
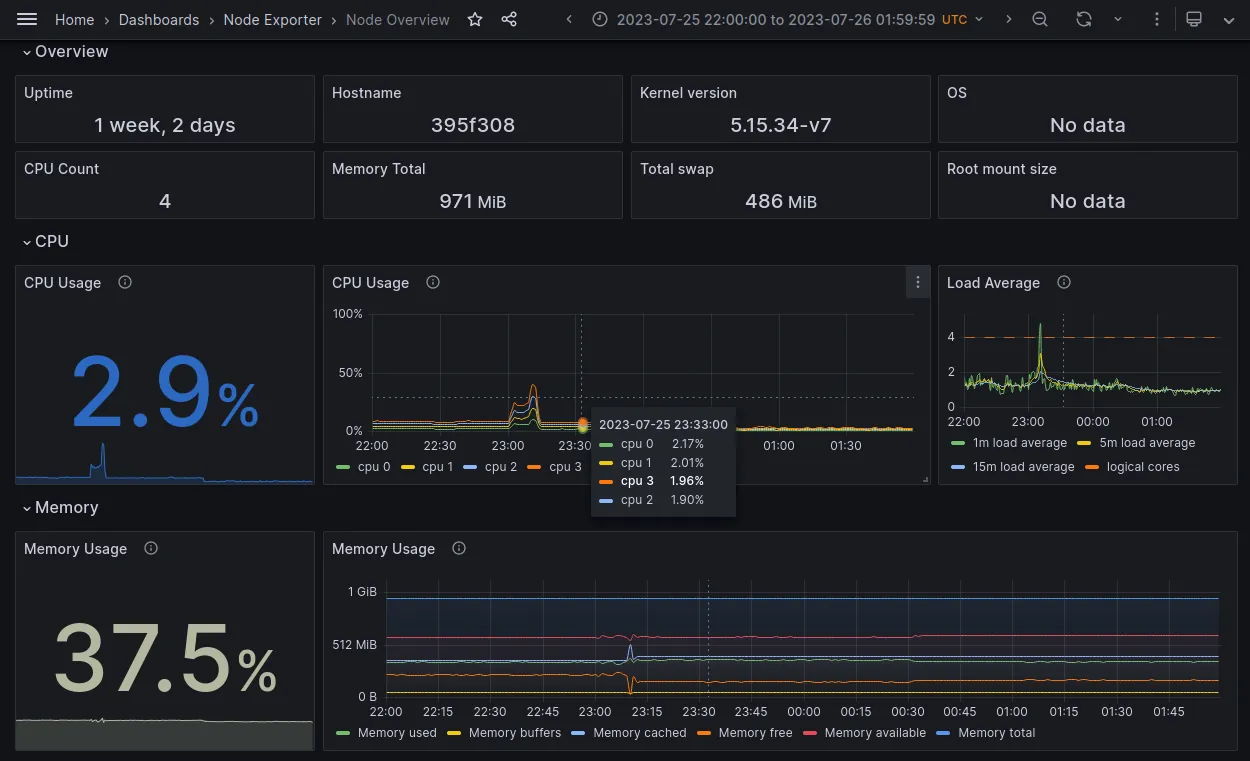
Observability is vital for remotely operated embedded devices, and we at balena always are on the lookout for better solutions. OpenTelemetry (OTel) is a CNCF project to provide vendor neutral reporting for metrics, logs, and traces. This post describes our encouraging exploration of OTel with Prometheus metrics and Grafana Cloud, like the overview below of a balena device. We also created a metrics reporting block so you can try it yourself.
We’re enthusiastic about:
- Small size on device: 110 MB of storage, 40 MB of memory
- Out of the box metrics like container statistics, and pluggable backends like Datadog
- Provides a platform for a balena metrics API or a monitoring service for our customers
OpenTelemetry
OpenTelemetry is an observability framework, which includes metrics, logs, and distributed traces. It includes a Collector agent that runs on a device or on a gateway near the device. The Collector scrapes or receives metrics from the device, optionally transforms or filters them, and exports the data to a compatible backend.

Icons from opentelemetry.io
The Collector is focused on modularity, and uses a plugin architecture. The contribution repository provides many useful implementations, including a Docker Stats receiver that we use below. While you can use a prebuilt release of the collector, you also can easily build a custom collector that contains only the plugins you need.
OTel also provides instrumentation libraries for several languages. The project aims to be vendor neutral and integrates with many third parties. It has become the second most active project in the CNCF, after Kubernetes.
Collector Block
We took advantage of the Collector to build the otel-collector-device-prom balenaBlock. We used the block to generate the metrics for the dashboards in this post, and you can too. The block repository README includes detailed setup instructions, including for Grafana Cloud.
The block includes these components:

- Prometheus node-exporter receiver for device metrics
- Docker Stats receiver for container metrics
- Resource processor to ensure all containers have required properties for the backend
- Prometheus remote write exporter for compatibility with Grafana Cloud
You can see how these components are specified in manifest.yaml. We then use the manifest to build a custom Collector, as shown in Dockerfile.template. This capability allowed us to reduce the size of the block to 110 MB for balena embedded devices. Finally, the Collector accepts a config.yaml file at runtime, where we configure the Resource processor to fill in some attributes required by our dashboards.
Overall, we found development of the block straightforward. It did take some time to figure out how to use the Resource processor, including some confusion with the similar Attributes processor. However, the adaptability of the processors meant we didn’t need to make any code changes to the Prometheus node-exporter receiver.
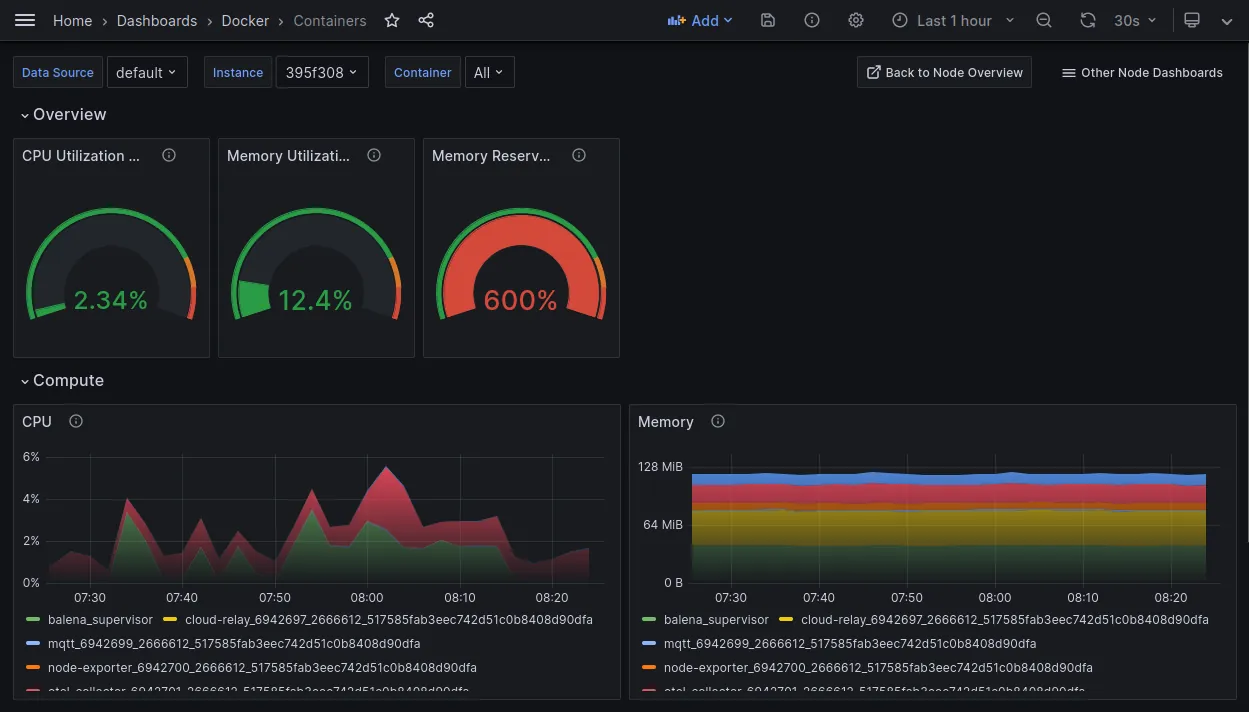
Give it a try yourself! All of the Grafana Cloud dashboards also are available, including one for Docker containers. For the example below, we added the collector block to a device running our Cloud Relay tool. Notice it includes the balena Supervisor container as well.
Next Steps
We are impressed with the modularity and flexibility of OpenTelemetry. Its vendor neutral approach and wide support work well with balena as a platform company. In the past we have recommended Datadog for monitoring (blog post). They, along with Grafana, New Relic and others, also provide backend support for OpenTelemetry. So this support may allow us to provide Collector metrics tuned for balena devices, and allow customers to use the backend that works best for them.
Here are some specific ideas for improvement:
- Provide metric data and tailor Grafana dashboards specifically for balena devices, for example chrony, dnsmasq, or GPU metrics.
- Use the Collector hostmetrics receiver rather than the separate Prometheus node-exporter to remove the resource requirements for that second container.
- Experiment with the journald receiver for system logs
- Experiment with a receiver for application data to remove the friction of a separate reporting mechanism. AWS, Azure, and Google Cloud all provide support for OpenTelemetry.
What features would you like to see for OpenTelemetry based device monitoring? Let us know in the balena Roadmap.