
One challenge of managing a fleet of dispersed IoT devices is gathering and monitoring device metrics in real-time. Let’s check out how companies like Datadog are adding monitoring capabilities using lightweight containers that are ideal for IoT and edge devices.
Datadog’s newest monitoring agent requires as little as 36MB of memory, 63MB of disk space, and very modest network throughput to handle reporting. The lightweight agent can provide detailed information about an IoT device’s running processes, available memory, and a host of other details.
Read on to learn more about how to use Datadog with your next edge app or project on balenaCloud.
Great monitoring with low overhead
IoT fleet managers and system administrators are likely familiar with monitoring tools for capturing logs, building dashboards, and monitoring applications, network traffic, and other events. Tools like Datadog, Netdata, Splunk, and New Relic feature slightly different capabilities and price tags. They collect information from a device (typically a server or endpoint), including operating system attributes and hardware resources. All of this is accomplished by installing a small program, called an agent, on each device or machine.
With containers, these agents no longer need to be installed on the host operating system, but can be run as separate microservices alongside other containers. This makes it easier to add agents to all the devices in your IoT fleet by adding the service to any application running on balenaOS.
The Datadog IoT Agent
You can try the new Datadog IoT Agent by filling out a form on the Datadog website and requesting access to it. They’ll send you installation instructions and go through a process similar to installing the regular version.
We’ve previously written about setting up Datadog for monitoring here, so you can refer to that article for a detailed look at the process.
Let’s take a look at how this slimmed down Datadog agent can have a big impact on your IoT device monitoring.
Why does a containerized IoT monitoring agent matter?
The first factor to consider when choosing between a regular, full-featured Datadog setup or a slimmed down or tuned agent are your target hardware and location. If you’re going to be pressed for memory — even on a device with 1GB or 2GB of RAM — these solutions are small, but pack lots of data.
The second critical factor is networking. If your remote devices will live in places with poor connectivity and constrained bandwidth, the small demands made by these agents make them quite appealing.
Typical monitoring agents running on servers or PCs might have negligible impact on the overall system, but can be resource-intensive on IoT devices. For example, the BeagleBone Green has 512MB of RAM, 4GB of eMMC, and a single-core TI Sitara Cortex-A8 SoC. Once you account for memory usage from the operating system, a container runtime, and one or two applications running in containers, you have very little memory left to work with. A Raspberry Pi 3A is similar, as are some NanoPi’s and other low-cost dev boards.
When using any of these devices, every megabyte counts, and Datadog’s lightweight IoT Agent might be small enough to make it practical on your IoT devices.
Needing only 36MB of RAM is well within the confines of the 512MB available on the devices mentioned above, but perhaps the biggest benefit for IoT applications is the network requirement. It helps to keep in mind the core concept of what Datadog is doing here: Telemetry and logging data are being sent from the device to Datadog for rendering in their cloud-based dashboard. When monitoring large servers or PCs with plenty of bandwidth, that data throughput is trivial.
However, for an IoT device sitting in a remote area connected via a 2G cellular connection, bandwidth is a precious and often costly commodity. At just over 300BPS combined up-and-down data transfer, the Datadog IoT Agent can do its thing even in regions with slow and spotty network coverage.
A note about logging
To be fair, the raw Datadog bandwidth numbers don’t include sending log data. When you measure throughput when some actual logs are being shipped, that increases CPU usage and network usage increases along with the size of your logs. That now raises a new item for consideration: Determining exactly what needs to be logged and shipped up to the cloud.
Even 14KB/s could saturate a slow cellular connection and be quite pricey depending on your data rates. As a fleet owner, the Datadog agents let you make the decision about precisely what telemetry, logs, and information you need to collect, and then balance that with your cellular data costs and device’s capabilities.
Why should you monitor your edge fleet?
Now that we know more about how the agents work and their requirements, let’s go through a sample use-case and demonstrate why this matters to a fleet owner.
We’ll use a great community-built home surveillance project, called Kerberos.io, for this demonstration. We’ve previously written about setting up Kerberos here, so you can that post for a deeper dive. Kerberos is an open source video surveillance application that can run on a Raspberry Pi or similar device, with a camera. It saves small video recordings when motion is detected in the camera frame. You can then view those recordings via a built in web interface.
Kerberos already has a fully containerized, one-click deployment option for balena (check out the link above to get started). Once that’s installed, you can add a new service (container) for the Datadog IoT Agent. Do this by creating a new project from scratch for this. You can create a folder on your computer, and start by cloning the Kerberos for balena project on GitHub. This creates a Docker Compose file and the Kerberos artifacts in their own subfolder, ready to go.
You can append changes to that Docker Compose file to account for the new Datadog container to be added, and make a folder that contains the needed Datadog Dockerfile. The end results looks like this:
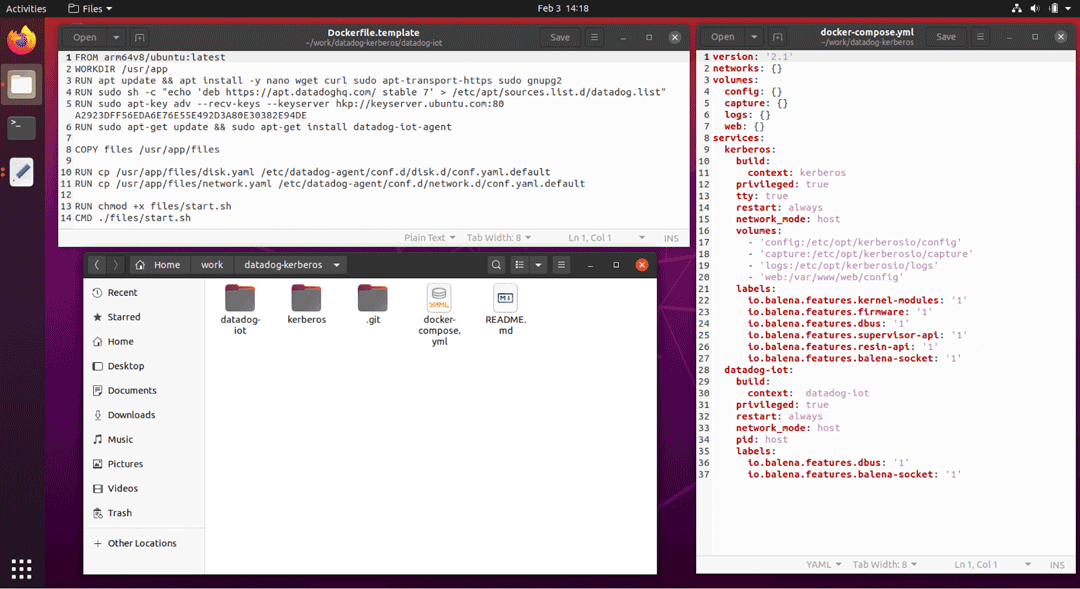
The easier route: You can clone our GitHub repo here to grab this same code, to save you some typing.
Now that you have your project ready, run balena push to your target application and wait just a few minutes for the project to build and download to your device. I’m using a Raspberry Pi 3 in this case, because I specifically want to know how well that device performs with Kerberos.
With monitoring running beside the application, we can better understand what the Kerberos application is doing, watch CPU consumption, network activity, and then determine if the application can use smaller hardware, or conversely need to upgrade to a more robust Raspberry Pi 4.
In my personal example, I’m only testing it on one device, but this granular view is helpful when inspecting the health of individual nodes in a fleet. And in general, charting the system resources over time, matching them up to events, and investigating log files are the forensic evidence a fleet owner needs when troubleshooting and isolating issues.
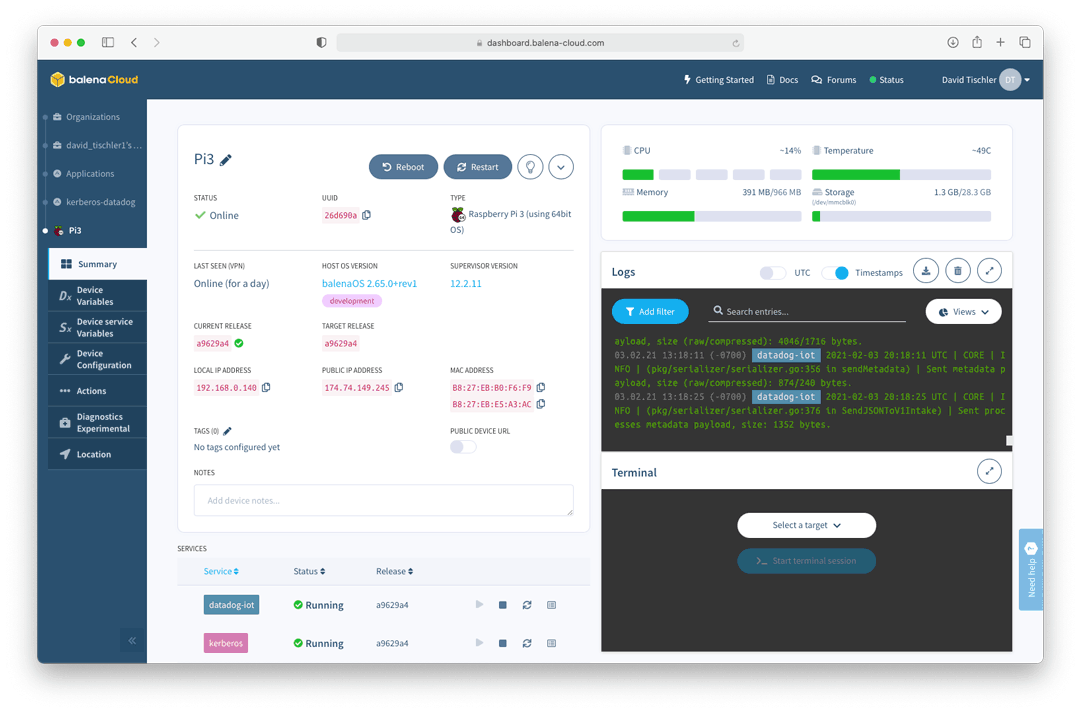
Back to our project, once the containers are deployed, you’ll see that the project is running just like any other typical balenaCloud project:
We have just a few more steps to complete though, before our device starts feeding its metrics into the Datadog dashboard. First, you do need an account with Datadog, so be sure to head over to datadoghq.com and create an account. Further instruction can be found here, but the end result is that you should receive an API Key.
Then, in balenaCloud, we need to add an Environment Variable for the devices containing that Key. On the left, click on the Application name, click on Environment Variables, and click Add Variable. Enter DD_API_KEY as the name, and your Key as the value. That is enough to now link the device up to Datadog.
Launch Kerberos and monitor device metrics
Now, let’s launch Kerberos, and have a quick look around. Grab your device’s IP from the device details page, and navigate to it in a browser. You’ll come to a Kerberos setup page, and after a few quick setup steps can eventually login with the username and password of root / root (you can change those credentials of course). Again, you can refer to our previous article for more details specific to Kerberos. Here’s the basic idea of what Kerberos will look like:

Next, let’s head over to Datadog and make sure data is arriving there. In your Datadog dashboard, click on Infrastructure, then click on the hostname of the device. You should see something similar to this:
Now, it is time to place a load on the Pi, and see what happens!
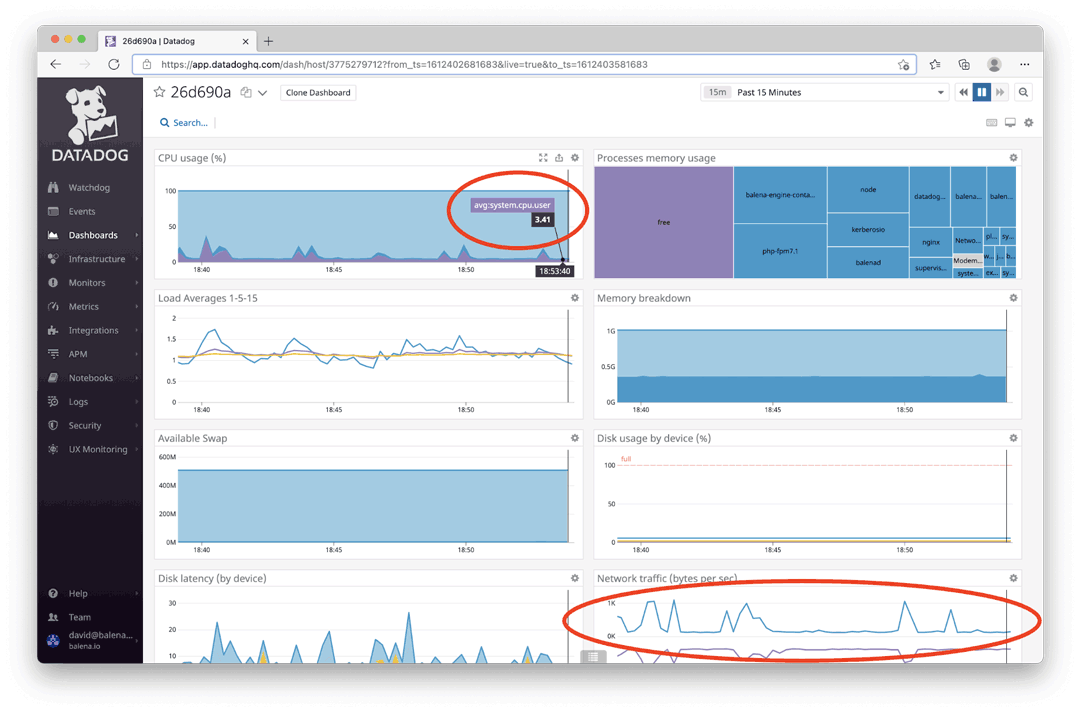
First, navigate to the ‘System’ page by clicking the link at the top right of the Kerberos application. It gives some basic information about the system, and has a few helpful links. While on this static page, not much is really going on. The Pi is not really “doing much” when you are on this page. While the system is sitting on that page, I go and check Datadog, and sure enough, there is minimal network activity, and the CPU load is rather low:
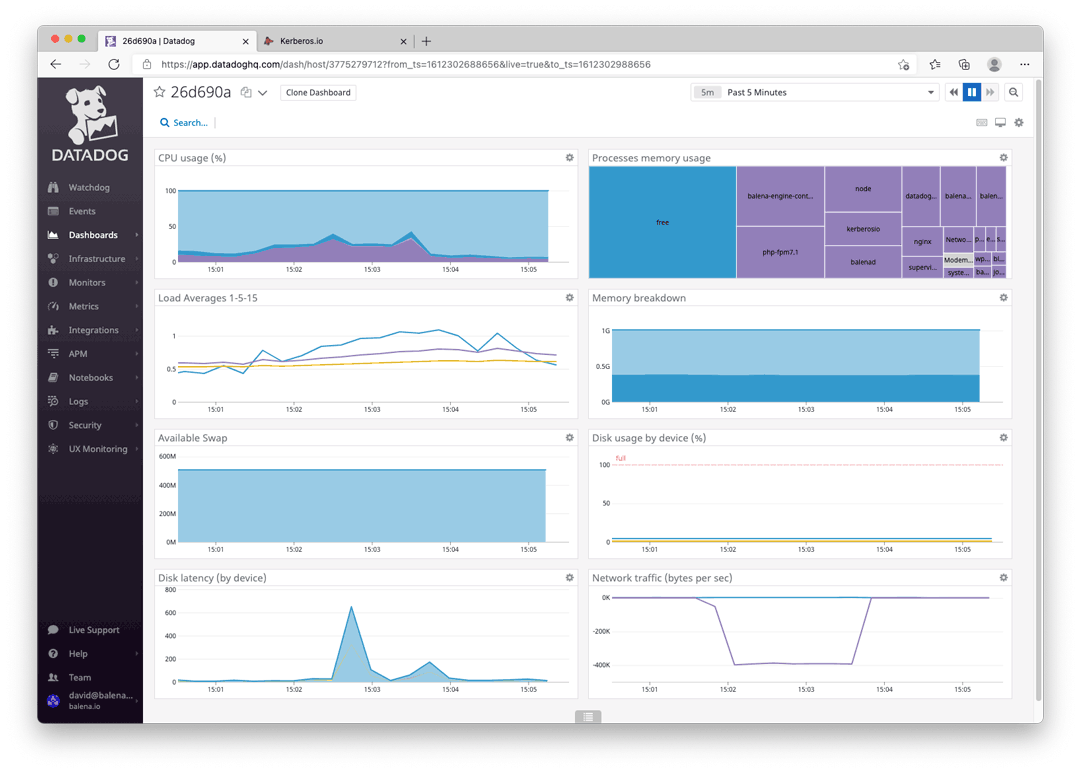
Now, click on ‘Dashboard’ on the top right of Kerberos. This page shows a live view of the camera, being streamed to your local browser. Ultimately, that means there are network packets flowing, and we can also assume that livestreaming will introduce some CPU load as well. After a few seconds, we can check back on the Datadog dashboard, and sure enough we can see the impact there:
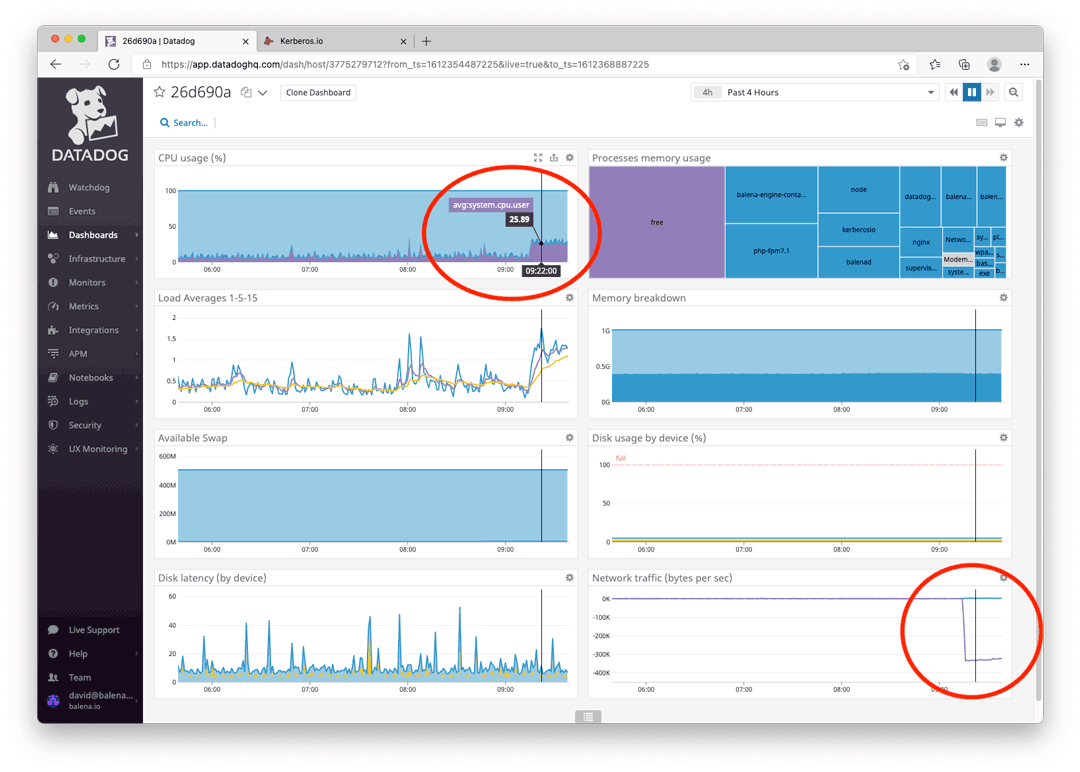
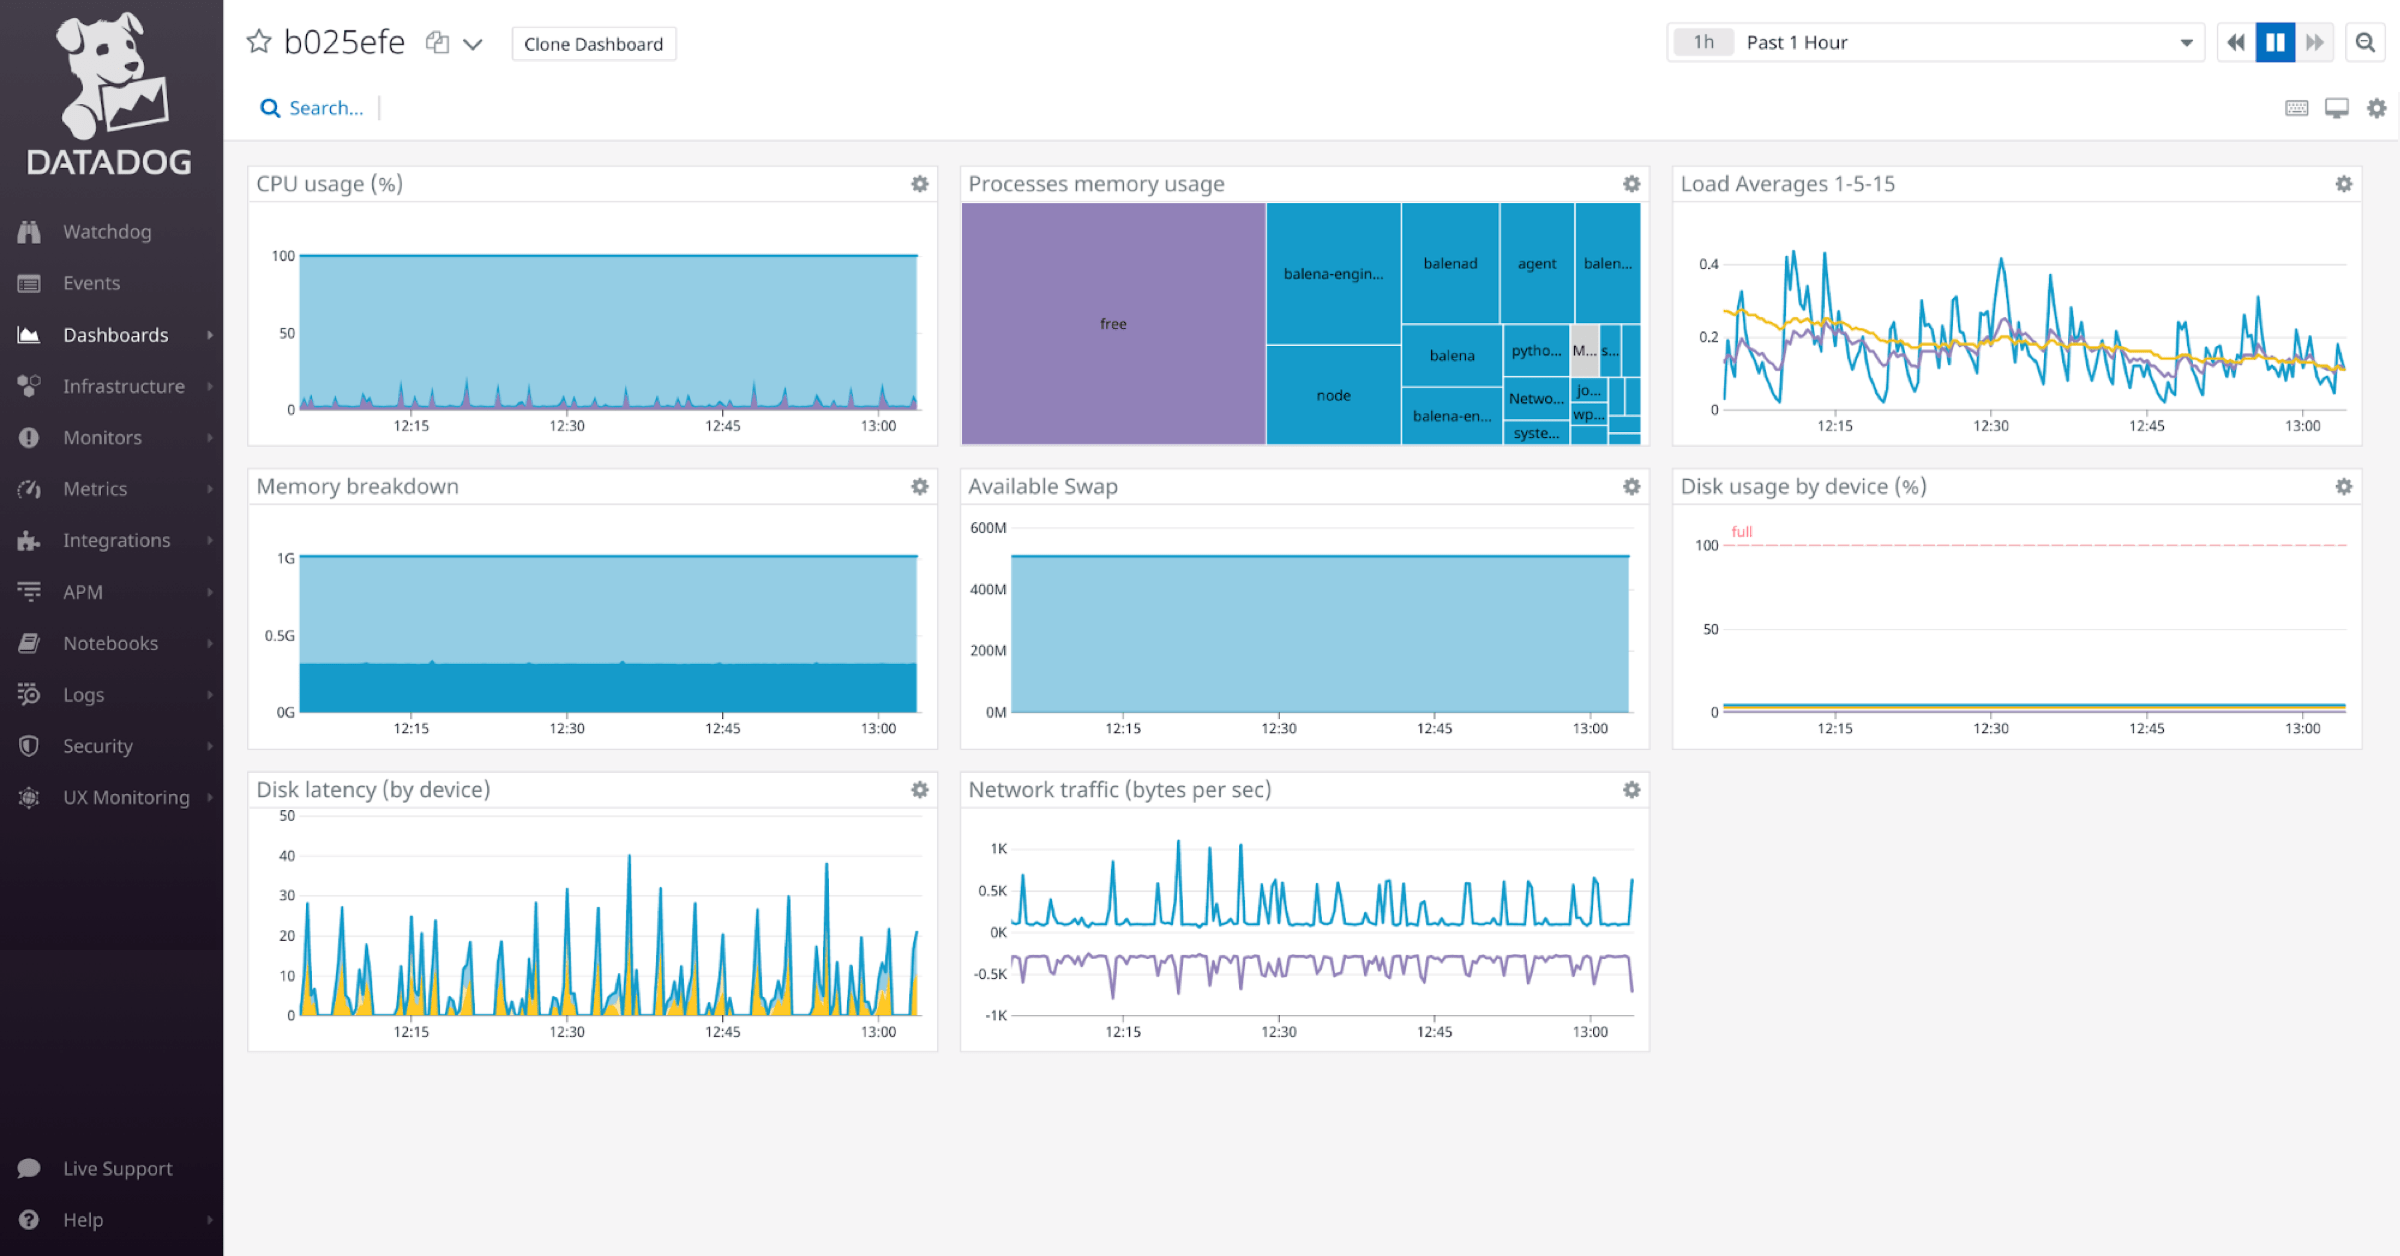
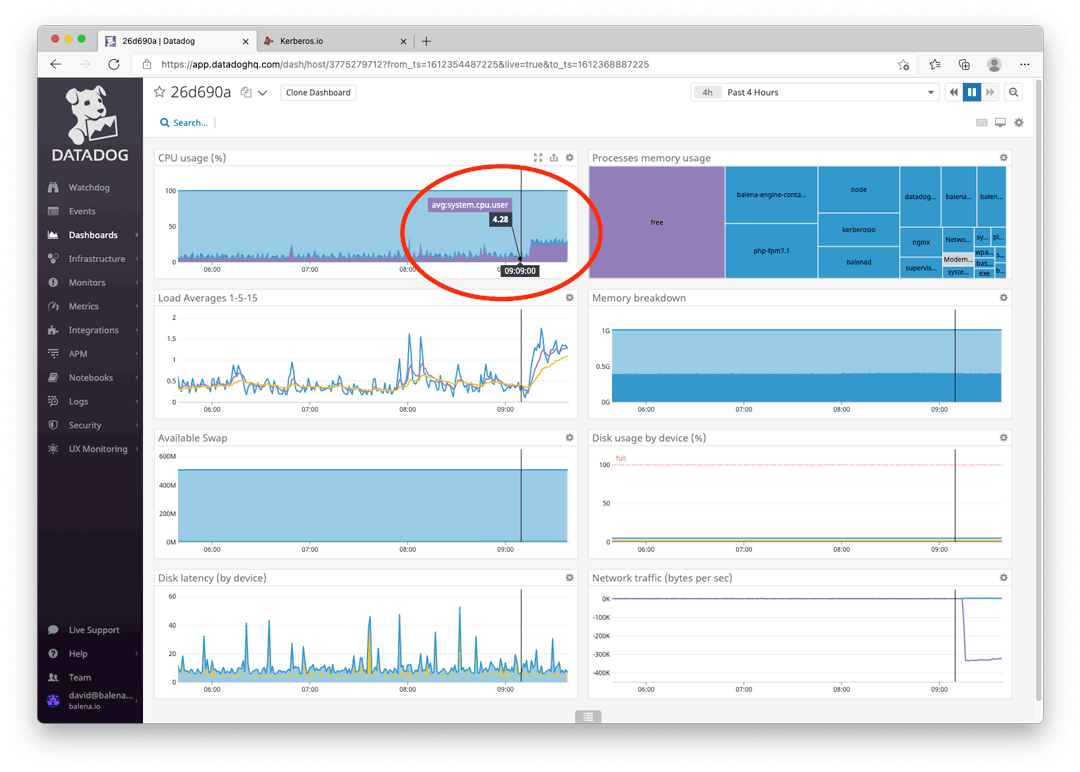
So, starting up the camera placed about a 26% load on the CPU, and is sending a bit over 300k per second across the network. Scrolling back on the timeline a few minutes, while the device was basically idling, we can see CPU usage was just over 4% and traffic was nominal:
Setting up alerting
Let’s briefly cover one last feature that comes out-of-the-box with both Datadog: “Alerting”. This is a capability that can send you an email or text message when a metric is crossed, threshold is breached, or a device simply stops responding or communicating, indicating it is offline.
Set this up by clicking on Monitors on the left hand menu, navigating to New Monitor, and then going through the wizard to select the metric and set the desired value that triggers the alarm. More information is available in the Datadog documentation, but the process starts with this:
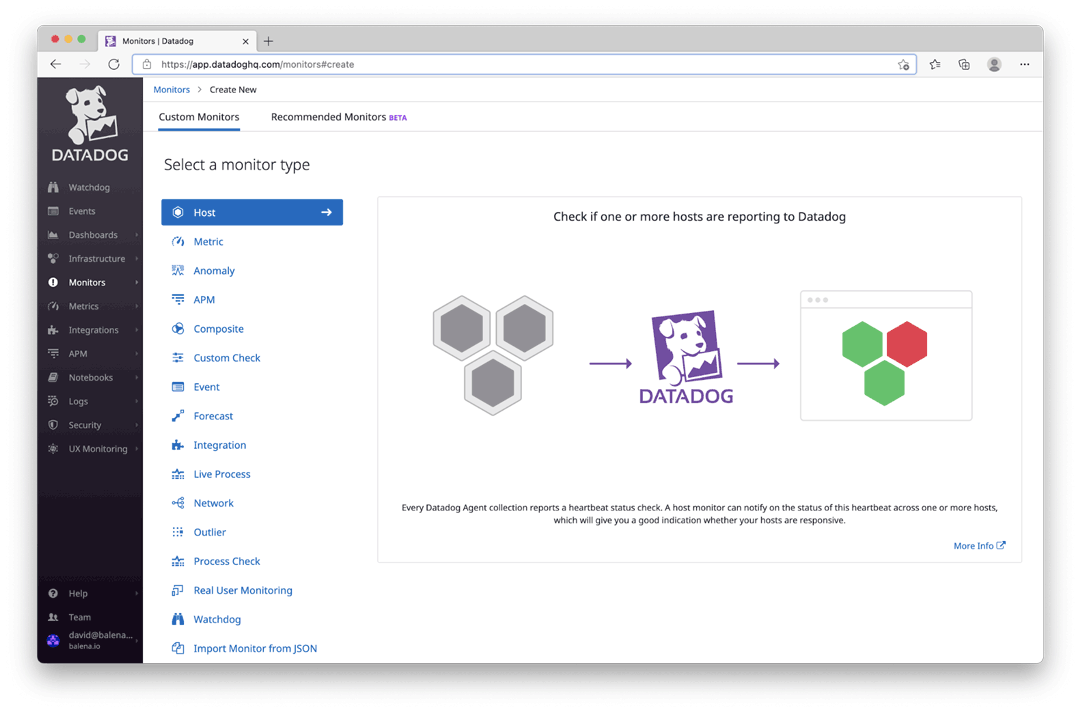
As an example, here I have configured the downtime alarm called “CPU / Offline” and now anytime a node stops reporting its activity into Datadog, an email is sent to me letting me know.

What’s next?
Hopefully, this gives you a good overview of how small, containerized agents can enable rapid real-time monitoring of your IoT devices running in balenaCloud. Check out Datadog’s detailed blog post to get a better understanding of its IoT Agent capabilities.
With these and other vendor offerings, you’ll be able to monitor IoT devices alongside your cloud and on-prem servers with tools that work across devices. Their data and monitoring capability might just allow you, the IoT fleet manager, to sleep better at night.
Stay tuned for a future guide on using other monitoring tools, like Netdata, with your devices and applications on balenaCloud. Until then, try this project out and let us know what you think on Twitter or on the Forums.