

This is the third and final part in a series that dives into logging sensor data with embedded Linux, containers, and Balena’s platform. The first part was a deep dive into how sensors can be read by embedded Linux, and the second part explored how to collect and graph sensor data with a TIG stack of services. This third part builds on the first and second parts to explore building a multi-device Balena application that logs sensor data from different devices.
Hardware and Setup
For this project you’ll need the exact same hardware and setup as from the previous two projects in the series:
In addition you’ll need a second Raspberry Pi 3 with an optional sensor connected to it:
Don’t worry if you don’t have the AM2302/DHT sensor, you can alternatively run a mock sensor collection script to collect fake data and still run and learn from this project.
Be sure to follow part 2 to create and deploy a sensor logging application to Balena Cloud before continuing.
Add Devices to Application
Let’s add a second Raspberry Pi 3 to the application we created in part 2 of this series. This second Raspberry Pi 3 will have a sensor connected to it and send its sensor readings to the first Raspberry Pi 3 running InfluxDB and the Grafana dashboard.
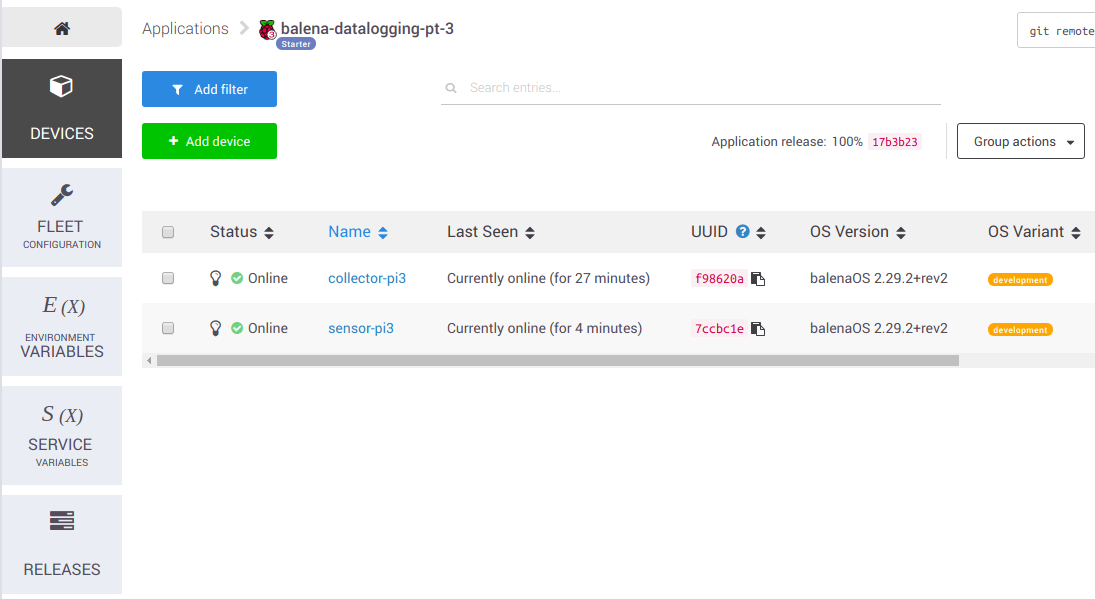
In Balena Cloud create a new application just as you saw in the previous part of this series. Add two devices to this application:
- One Raspberry Pi 3 with the name collector-pi3. This will be the device that runs the full TIG stack to collect and graph sensor data. Assign this Raspberry Pi a static IP address on your network so that it can easily be discovered and reached by other devices. Connect the Enviro-pHAT to this Raspberry Pi too.
- A second Raspberry Pi 3 with the name sensor-pi3. This will be a second device with its own unique sensor that it will read and send measurements to the collector device. If you’re using the AM2302/DHT sensor connect it to the Pi’s GPIO pins following its guide and using Pi GPIO #18 to read the sensor’s data output line.
Make sure both your devices are booted, connected to the Internet, and visible in the application on Balena Cloud:
Configure Environment Variables
Before pushing code to the devices you must add a new global environment variable. The INFLUXDB_HOSTNAME variable should be set to the IP address of the collector-pi3 device (the Raspberry Pi that was setup with a static IP). In addition, all other variables set in the previous part of this series should be set too:

Push Application Code
Once the devices are running and the environment variables are configured, you’re ready to push code to the Balena application git repository. The steps are exactly the same as with the previous part of this series, however this time you’ll want to use the application code from Github here:
git clone https://github.com/balena-io-playground/balena-logging-sensors.git
cd balena-logging-sensors/part_3/app
git init
git remote balena <your account>@git.balena-cloud.com:<your account>/balena-datalogging-pt-3.git
If you’re using a real AM2302/DHT sensor with the sensor-pi3 device you’ll want to slightly modify the docker-compose.yml file to enable the real sensor measurements. Scroll down to the dht-sensor service in the file:
dht-sensor:
  build: telegraf
  depends_on:
    - dtoverlay-dht
  environment:
    - 'RUN_ON_DEVICES=sensor-pi3'
    - 'TELEGRAF_EXEC_COMMAND=/collect/mock_dht_sensor.sh'
  restart: on-failure
Change the TELEGRAF_EXEC_COMMAND to point at the /collect/dht.sh script instead of the /collect/mock_dht_sensor.sh script:
dht-sensor:
  build: telegraf
  depends_on:
    - dtoverlay-dht
  environment:
    - 'RUN_ON_DEVICES=sensor-pi3'
    - 'TELEGRAF_EXEC_COMMAND=/collect/dht.sh'
  restart: on-failure
If you keep the mock_dht_sensor.sh script in the compose file you’ll get fixed, fake humidity and temperature for testing sent to the collector.
Now commit and push the code to Balena’s remote repository:
git add --all
git commit -m "Initial commit"
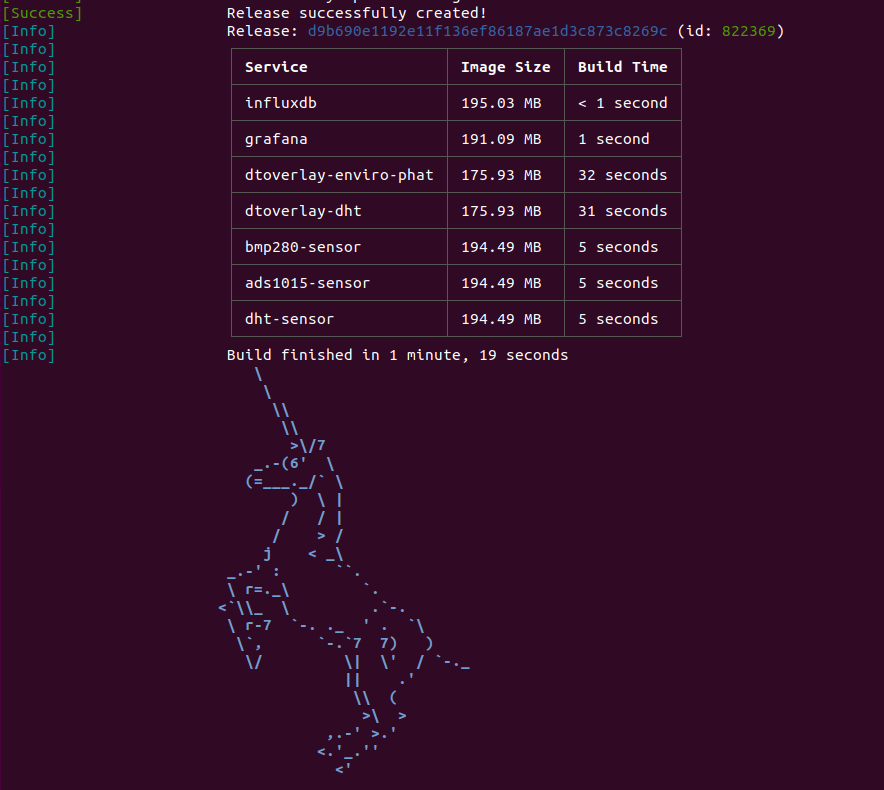
git push balena master
You should see many containers build and the happy unicorn that signals a successful deployment:
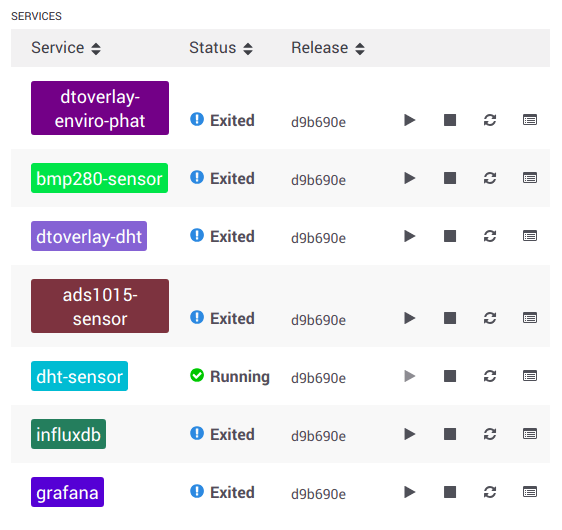
After the containers are sent to the devices you should see each device running a number of different containers. The collector-pi3 device should be running the influxdb, grafana, ads1015-sensor, and bmp280-sensor containers:

The sensor-pi3 device should be running just the dht-sensor container:
Sensor Dashboard
Now connect to the collector-pi3 device Grafana dashboard. If you’re setting up a new application you’ll need to login with the admin/admin username and password again just like in the previous part of this series.
Try adding a new dashboard and panel to read from either the fake_dht_sensor or dht_sensor measurement, depending on if you’re using the mock/fake sensor data (default) or real sensor data (modified docker-compose.yml above).


Add more panels to show all the sensors on the dashboard!
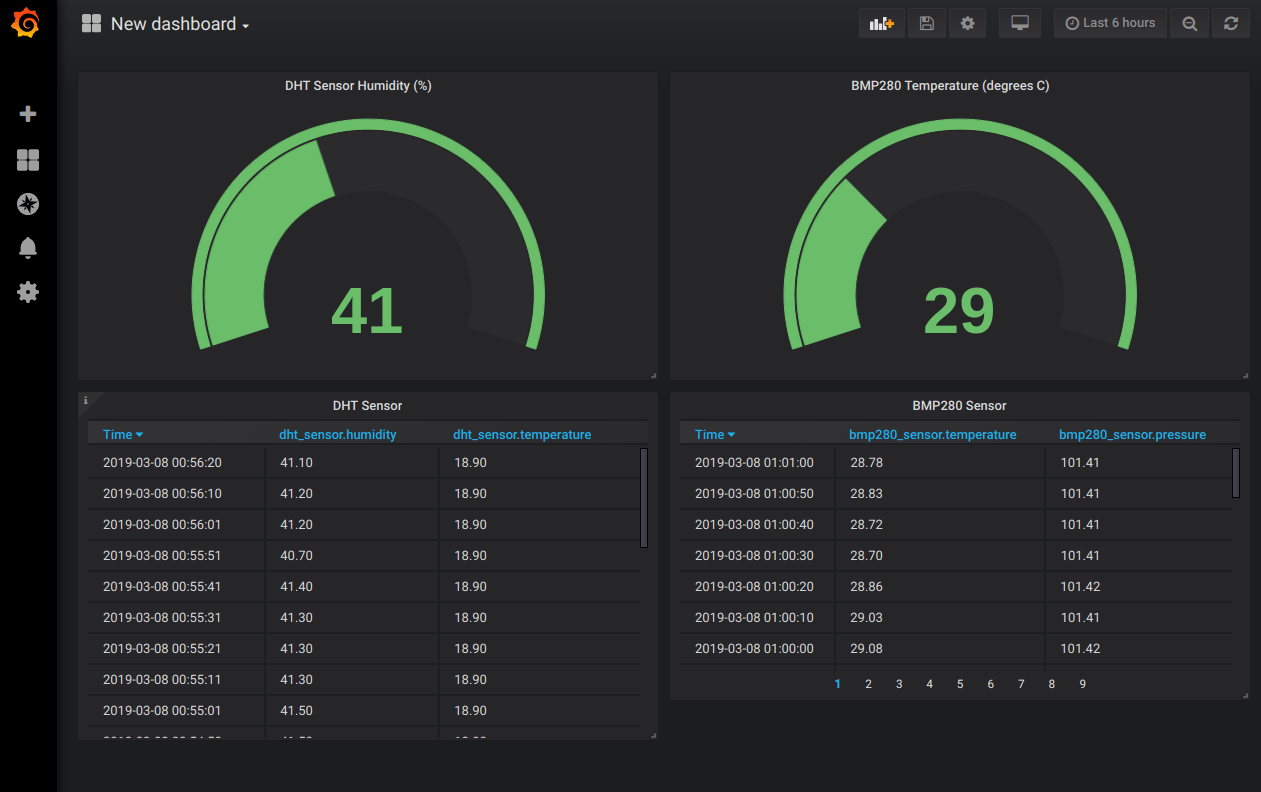
Now that you see the entire application running and data flowing from both devices into the collector-pi3 dashboard, let’s examine the docker-compose.yml to understand how this multi-device application works.
docker-compose.yml
Notice the docker-compose.yml is slightly more complex than the previous part of this series:
version: '2'


services:


  influxdb:
build: influxdb
environment:


  - 'RUN_ON_DEVICES=collector-pi3'
ports:
  - '8086:8086'
restart: on-failure
volumes:
  - 'influxdb-data:/var/lib/influxdb'


  grafana:
build: grafana
depends_on:


  - influxdb
environment:
  - 'RUN_ON_DEVICES=collector-pi3'
ports:
  - '80:3000'
restart: on-failure
volumes:
  - 'grafana-data:/var/lib/grafana'


  dtoverlay-enviro-phat:
build: dtoverlay
command: apply_overlays enviro-phat
environment:


  - 'RUN_ON_DEVICES=collector-pi3'
privileged: true
restart: no


  dtoverlay-dht:
build: dtoverlay
command: apply_overlays dht
environment:


  - 'RUN_ON_DEVICES=sensor-pi3'
privileged: true
restart: no


  bmp280-sensor:
build: telegraf
depends_on:


  - dtoverlay-enviro-phat
environment:
  - 'RUN_ON_DEVICES=collector-pi3'
  - 'TELEGRAF_EXEC_COMMAND=/collect/bmp280.sh'
restart: on-failure


  ads1015-sensor:
build: telegraf
depends_on:


  - dtoverlay-enviro-phat
environment:
  - 'RUN_ON_DEVICES=collector-pi3'
  - 'TELEGRAF_EXEC_COMMAND=/collect/ads1015.sh'
restart: on-failure


  dht-sensor:
build: telegraf
depends_on:


  - dtoverlay-dht
environment:
  - 'RUN_ON_DEVICES=sensor-pi3'
  - 'TELEGRAF_EXEC_COMMAND=/collect/dht.sh'
restart: on-failure


volumes:
influxdb-data:
grafana-data:
Let’s examine each service again and look at how it differs from the previous project.
influxdb Service
The influxdb service has two important changes in this version of the application:
-
A special balena_entrypoint.sh script is used as a new entrypoint for the container. This script is the key to creating a multi-device application with different code running on different devices. Currently with Balena applications they send all of the containers down to all of the devices. This is great if you need every device to run the same services, but if you need to only run some services, like the TIG stack, on a specific device this special entrypoint can help.
The entrypoint works by reading the RUN_ON_DEVICES environment variable and only starting the service if it’s on a device in the list. Notice the influxdb service specifies that RUN_ON_DEVICES=collector-pi3, this means the influxdb service will only start and run on the collector-pi3 device. The sensor-pi3 device will still be sent the influxdb container, but when it runs the entrypoint will see the mismatch in device name and not start the service.
You’ll see this pattern with the entrypoint script and RUN_ON_DEVICES variable in all of the services for this application, it’s very handy to use in your own complex multi-device applications!
-
InfluxDB is configured with a self-signed SSL certificate to encrypt communication with it. This is done as a best practice to help lock down and secure the system. Since other devices on the network now need to access the influxdb service it opens up a vector for attackers to snoop and spoof traffic. You can see in the Dockerfile how a simple self-signed SSL certificate is generated and stored–this works for a reasonable level of security and prevents casual snooping, but might not be secure enough for a true production environment (in which case real SSL certificates should be purchased from a trusted authority and used in place of self-signed ones).
grafana Service
There’s almost no change to the grafana service in this version of the application. You’ll see the new entrypoint script added and RUN_ON_DEVICES is set, but otherwise the service is the same as in the previous project.
dtoverlay-enviro-phat and dtoverlay-dht Services
These services are also unchanged with the exception of the entrypoint and RUN_ON_DEVICES addition.
Notice there are now two overlay services, one to run on each device and configure the appropriate device tree sensor overlays. You can examine the DHT sensor overlay in the dtoverlay/overlays folder if you’re curious to see how this overlay defines a AM2302/DHT sensor connected to pin 18 of the Raspberry Pi GPIO.
bmp280-sensor, ads1015-sensor, and dht-sensor Services
These services use the telegraf image in much the same way as the previous project. Again the entrypoint script and RUN_ON_DEVICES variable are added to allow multi-device use.
In addition the telegraf.conf configuration has an important change to now read the address of the InfluxDB server from the INFLUXDB_HOSTNAME environment variable. This allows any device on the network to send data to the single InfluxDB instance running on the collector-pi3 device. You can think of using an environment variable like this as a very basic form of service discovery, where one service looks up in a central store the location of another service it needs to talk to. There are very sophisticated systems available for more complex service discovery needs like consul or etcd that you might evaluate and consider using for your own multi-device application.
That’s all there is to this multi-device sensor datalogging dashboard project!
Summary
Let’s summarize what we’ve learned through all three parts of this series:
- The first part was a deep dive into using sensors with modern embedded Linux and systems like Industrial I/O (IIO).
- The second part built on the first one to show how a mult-container Balena application can easily build a full-featured sensor dashboard with the TIG (Telegraf-InfluxDB-Grafana) stack of services.
- The third part here built on the previous two parts to extend the application to support multiple devices running independent sensor datalogging containers.
This project can serve as a blueprint for building your own simple or complex sensor datalogging project. You can start with just a single board and sensor, and scale up to hundreds of devices all sending data to a beautiful, centralized dashboard!
If this post has raised any questions or you’d like to know more, please join us in our forums, on Twitter @balena_io, on Instagram @balena_io or on Facebook where we’d be more than happy to answer!
