

Factories and industries which have been manufacturing for many years can benefit significantly from digitalization. Digitalization is related to the use of digital technologies to improve operations, increase efficiency and visibility, among others. As you can imagine, one of the most used technologies in the digitalization process are computers and the Internet.
Nowadays, computers and the Internet mean edge devices such as Industrial IoT gateways. These help to reduce the friction on the factory digitalization with the deployment and remote maintenance of industrial installations. The legacy industrial machinery with operational software such as HMIs, SCADAs and PLCs can connect with legacy protocols to single board computers in the edge with services that can ingest and process the data in the edge, receive operation orders or perform maintenance tasks, among others.

This integration, among old industrial machinery and the edge computing, will require using the machine’s physical interfaces, their protocols, special or proprietary drivers, and, of course, the application that will access and interpret the different parameters relevant for the analysis. The main goal of an Industrial Internet of Things (IIoT) system is to help legacy factories to become more efficient, effective, and competitive in a market rapidly-changing environment.
Here we describe how balena can help legacy industrial companies to manage IoT gateways with a container-focused approach for the Industrial Internet of Things. On this approach, we are going to use open-source technologies available for everyone based on the MING stack: Mosquitto (MQTT), InfluxDB, NodeRED and Grafana.
What is a legacy factory?
One of the most used protocols used among industrial machinery is Modbus (Modbus RTU and Modbus TCP). Modbus is a data communication protocol being used in PLCs (Programmable Logic Controller) and industrial environments for more than 40 years. Modbus is available in most of the industrial machinery as it’s an open protocol and it’s easy to deploy and maintain.
Firstly, Modbus is a master/slave request protocol and it’s not an events-oriented protocol. That means that the only way to get data is to continuously pull the data from all the devices connected in the network to detect if there are changes in the data that show that something is going wrong during the manufacturing process. On the other hand, most of the industrial businesses are event-oriented and they use protocols such as the publish/subscribe (e.g. MQTT). A pub/sub protocol such as MQTT solves the approach of triggering actions when something wrong happens.
The most used strategy on the legacy factories nowadays is to connect legacy instruments in a factory, and take the advantage that most of the machinery use Modbus, pull that data into the IoT gateway running in the edge and move towards a real-time strategy using pub-sub protocol such as MQTT. Industrial companies can be updated in real-time if anything goes wrong during the manufacturing process only adding an Industrial IoT gateway, and not updating any legacy device.
The legacy factory of the tutorial
In this blogpost we are going to connect an Advantech Industrial IoT Gateway (based on x86 device type) into the factory network that is running some industrial legacy electrical elements with Modbus TCP.
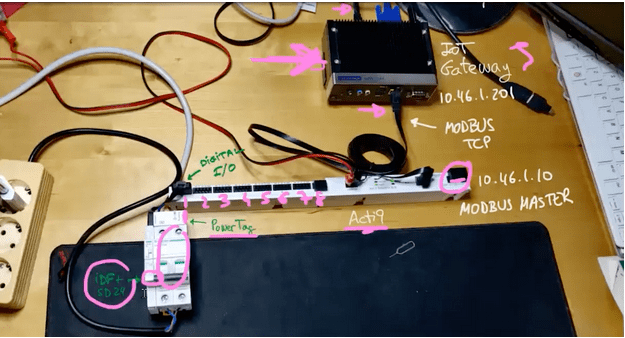
The Modbus Master is a Schneider Electric Acti9 Smartlink Modbus component that is connected to the Advantech Industrial IoT Gateway via Ethernet. The device has 8 digital input/output connectors, it also has a connector to connect other Modbus slaves and more. Being the Modbus Master means that we are going to be able to access the memory registers of the Schneider Electric Acti9 Smartlink and monitor all the machinery connected to it.
Modbus allows us to direct access to the memory of any device that uses the Modbus protocol in the network. That could be dangerous, as if we set specific data on a device, that change can automatically affect the device itself and change the behavior of it. In this case, we are going to use Modbus TCP (not Modbus RTU) that allows us to move the data on the top of the TCP/IP network.
Connected to the Acti9 Smartlink we will have some electrical elements connected through the Acti9 digital I/O such a Schneider Electric circuit breaker iOF+SD24 and a Power Tag (that allow us to read the voltage, the current and the power of the current that goes through the circuit).
Usually, the Schneider Electric Acti9 Smartlink is being used on systems that require energy metering and electrical monitoring of the systems, among others on industrial and commercial use cases.
Hardware required
- Advantech ARK-1124
- USB stick to flash the operating system on the Advantech computer.
- Ethernet cable.
We are also going to use these industrial elements, however if you have a Modbus Master running other devices, that will work properly as well.
- Schneider Electric Acti9 Smartlink Modbus
- Schneider Electric IOF+SD24
- Schneider Electric PowerTag
Software setup
- A free balenaCloud account (sign up here). Remember: your first ten devices are free and fully-featured.
- Software to flash the Advantech computer. E.g. balenaEtcher
Deploy the Industrial Gateway Application with balena
Find the application on the repository and click on the button Deploy with balena.
Create a new fleet and check that the release is being deployed as a new release on the fleet.
Add the Advantech IIoT Gateway
Click Add new device to download the balenaOS image for your IIoT Gateway based on x86 (Generic x86_64).
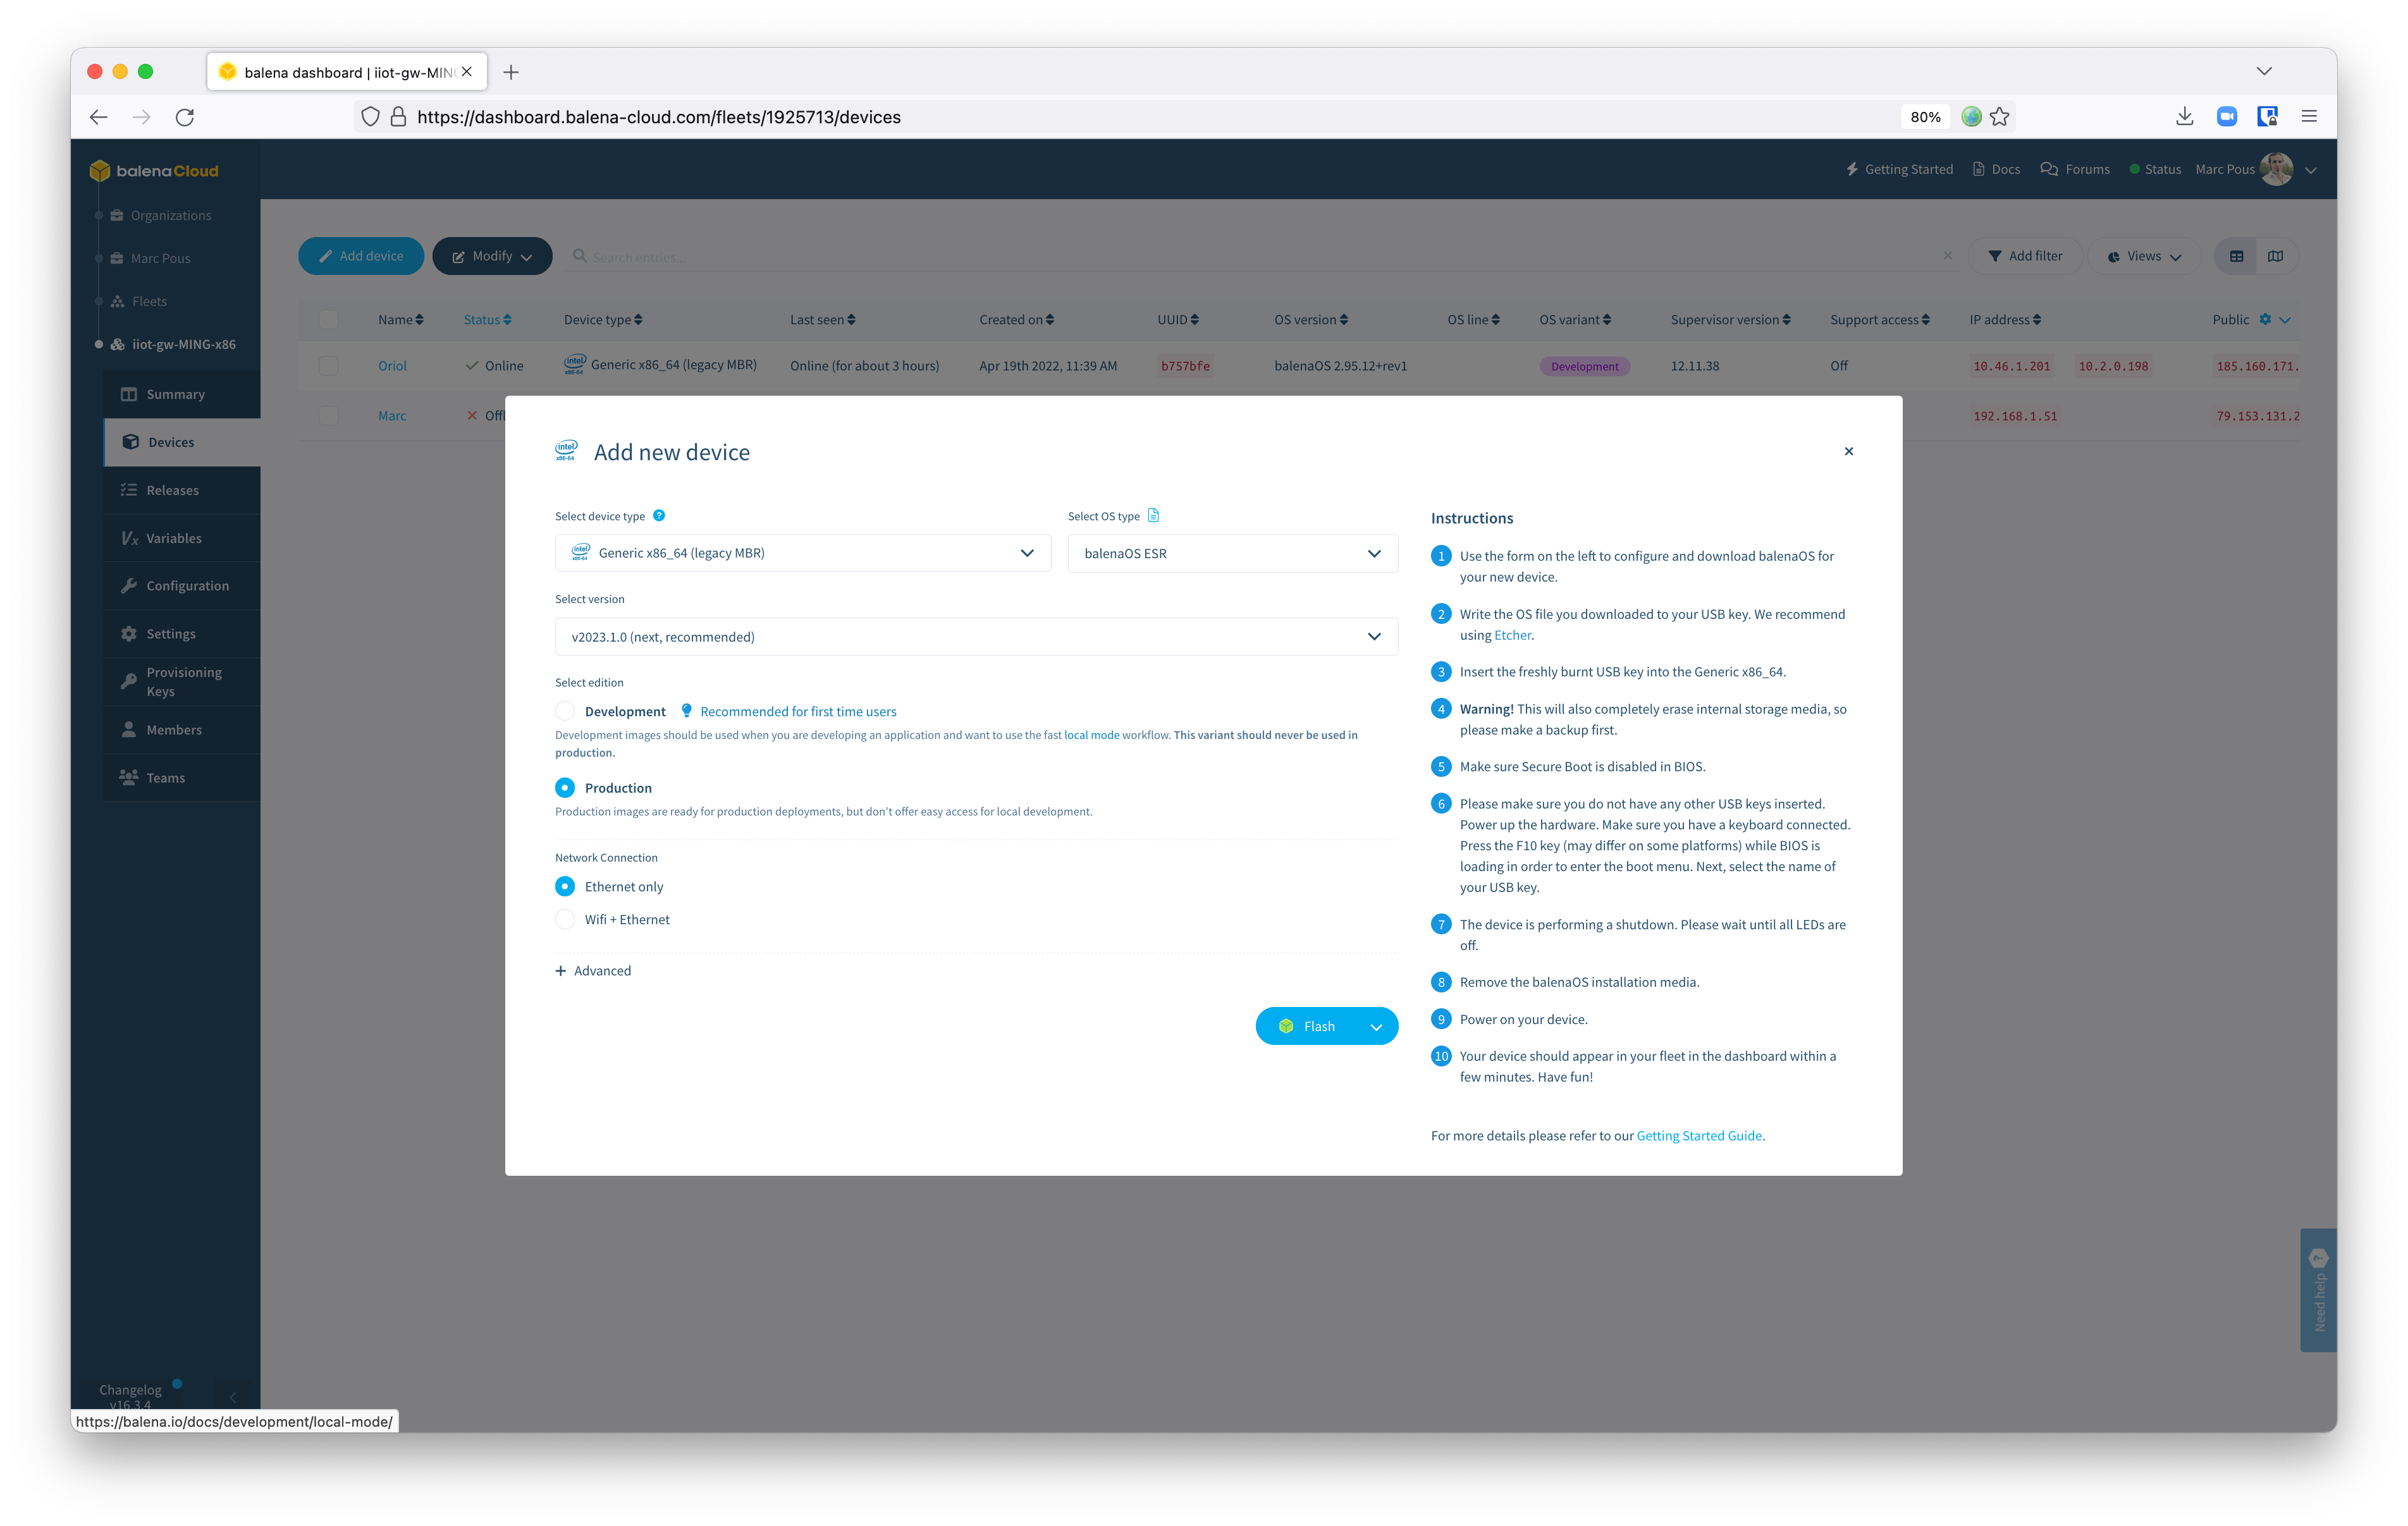
Select the latest balenaOS version, add your WiFi credentials (if you want to use WiFi) and download balenaOS for your new device.
Use Etcher to flash the OS image file you downloaded to a USB key. Once flashed, insert the freshly burnt USB key into the IIoT Gateway (Generic x86_64). Remember that this operation will completely erase internal storage media, so please make a backup first if there is interesting data that you would like to maintain.
Make sure Secure Boot is disabled in BIOS. Connect a display using HDMI (or similar), a keyboard and a mouse and make sure you do not have any other USB keys inserted. Power up the hardware and press the F10 key (may differ on some platforms) while BIOS is loading in order to enter the boot menu. Once on the boot menu of the device, select that you want to boot from the USB, and select the name of your USB key.
At this point the balenaOS image will be installed on the IIoT gateway eMMC memory. Once finished, the device will power off. Please wait until all LEDs are off. Now remove the balenaOS USB key.
Once the USB key is removed, power on your gateway. Your device should appear in your fleet in the dashboard within a few minutes.

If you would like to change the default user and password from NodeRED, go to the Device Variables section and change the USERNAME and PASSWORD variables from there. On the other hand, you can change the NodeRED port modifying the variable PORT. By default is on port 80, so you can access from the balena Public Device URL. Once changed, the device will restart.

Manage industrial data with NodeRED
Once all the services are online and running without any issue, introduce on a browser the local ip address with the port 1880. Use the credentials balena / balena as username and password. We strongly recommend to change the default nodeRED credentials using the device variables for security reasons. To change the variables, as described above, go to Device Variables.
Check on the palette that all the libraries are installed properly. You will find the Modbus, buffer parser, influxDB and balena supervisor plugins installed among others.
Now it’s time to start defining all the elements of the flow configuring the Modbus nodes and addresses. The main aim of the first flow we are going to create is to pull the Modbus data from the Modbus Master, parse the data and publish the data through a topic on MQTT. Afterthat on another NodeRED flow we will have a MQTT subscriber to the previous topics and will store the data into the InfluxDB database.
Before creating the Modbus reader nodes, we will need to understand the network topology of our machinery in the factory. On the image above we have all the ip addresses where the Modbus Master is defined (in this example it’s on the 10.46.1.10).
Add a Modbus Reader node on the flow, and go to Server on the bottom of the editor. And click the pencil to edit the fields of the Modbus Server on NodeRED.
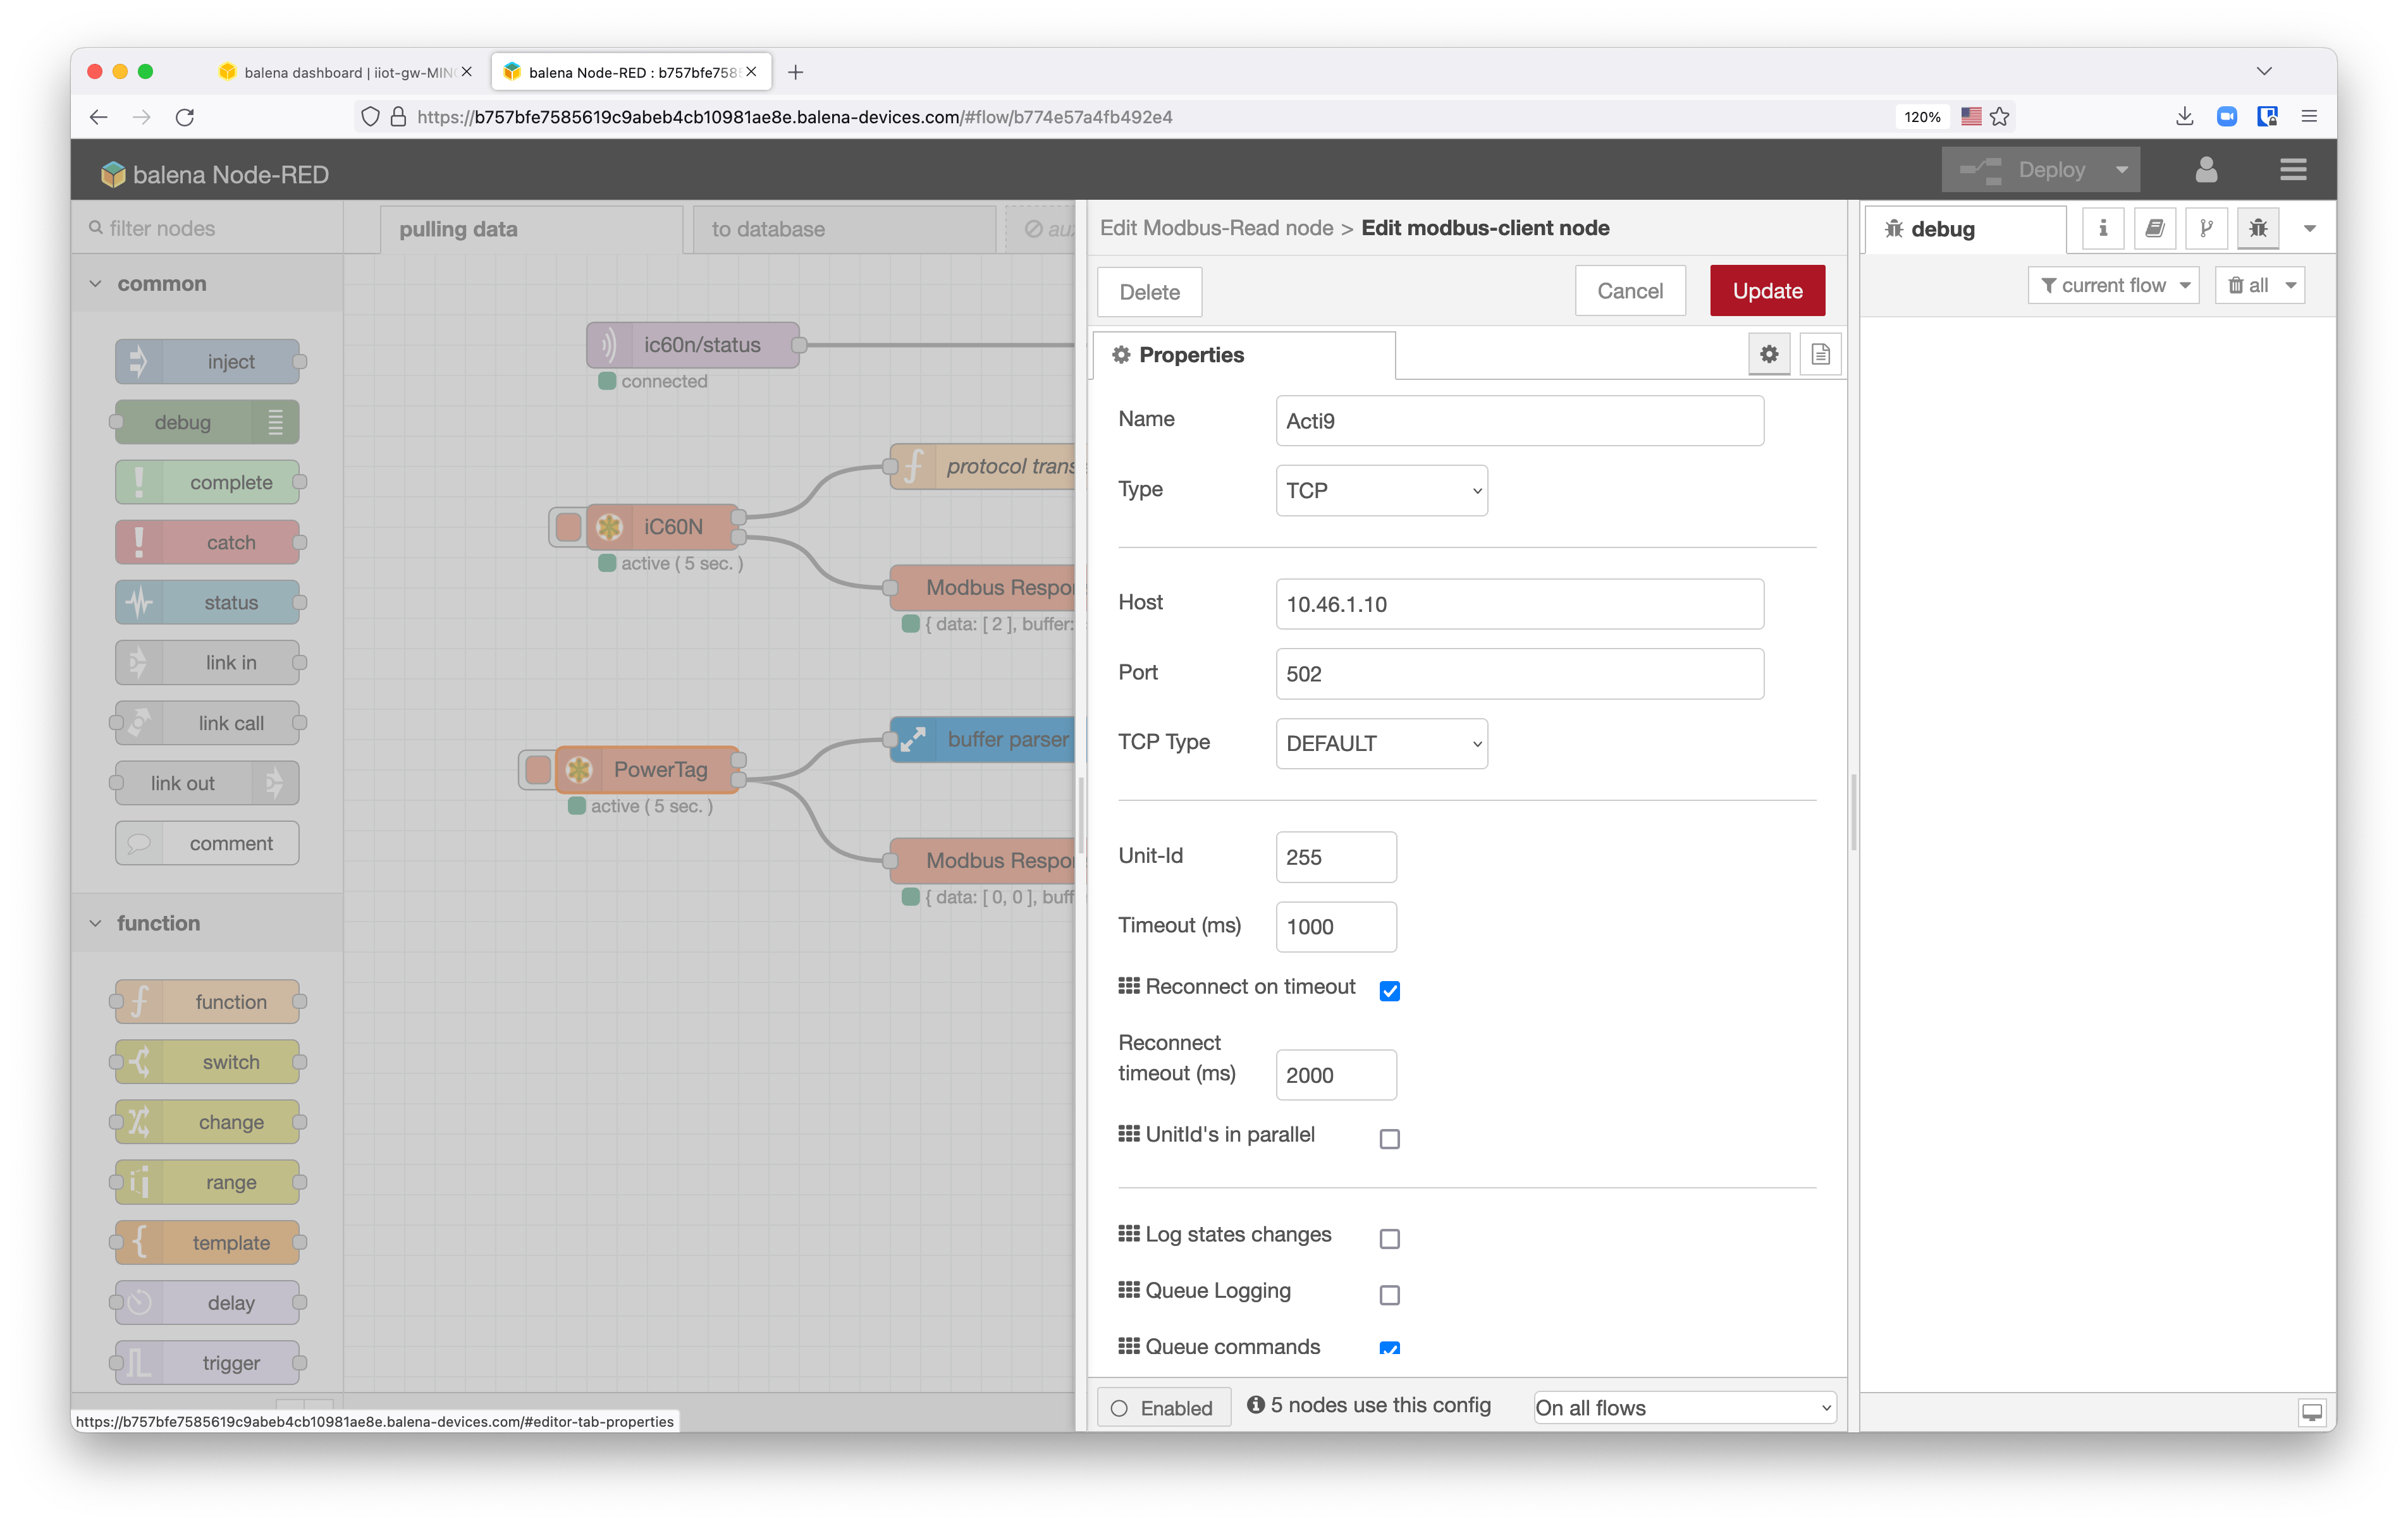
In this case with the Acti9 Smartlink Modbus, we are going to use the Modbus TCP protocol (instead of the legacy Modbus Serial), so we need to select Type as TCP. Define the Host address with the local IP of the Modbus Master device and the Port as the TCP port 502. The Unit-Id is the address to access the data of the Acti9 Modbus Master which is 255. If the connection is correct, you will see a green LED saying that the Modbus connection is active.
Register the machinery on Modbus
Now it’s time to add the machinery from the factory. First of all, it’s important to have access to the manual of the Modbus Master to understand how to access to all the information. Check in the Acti9 Smartlink Modbus manual all the information on the Modbus Registers Tables to double check the correct registers where you need to read the data from your machinery.
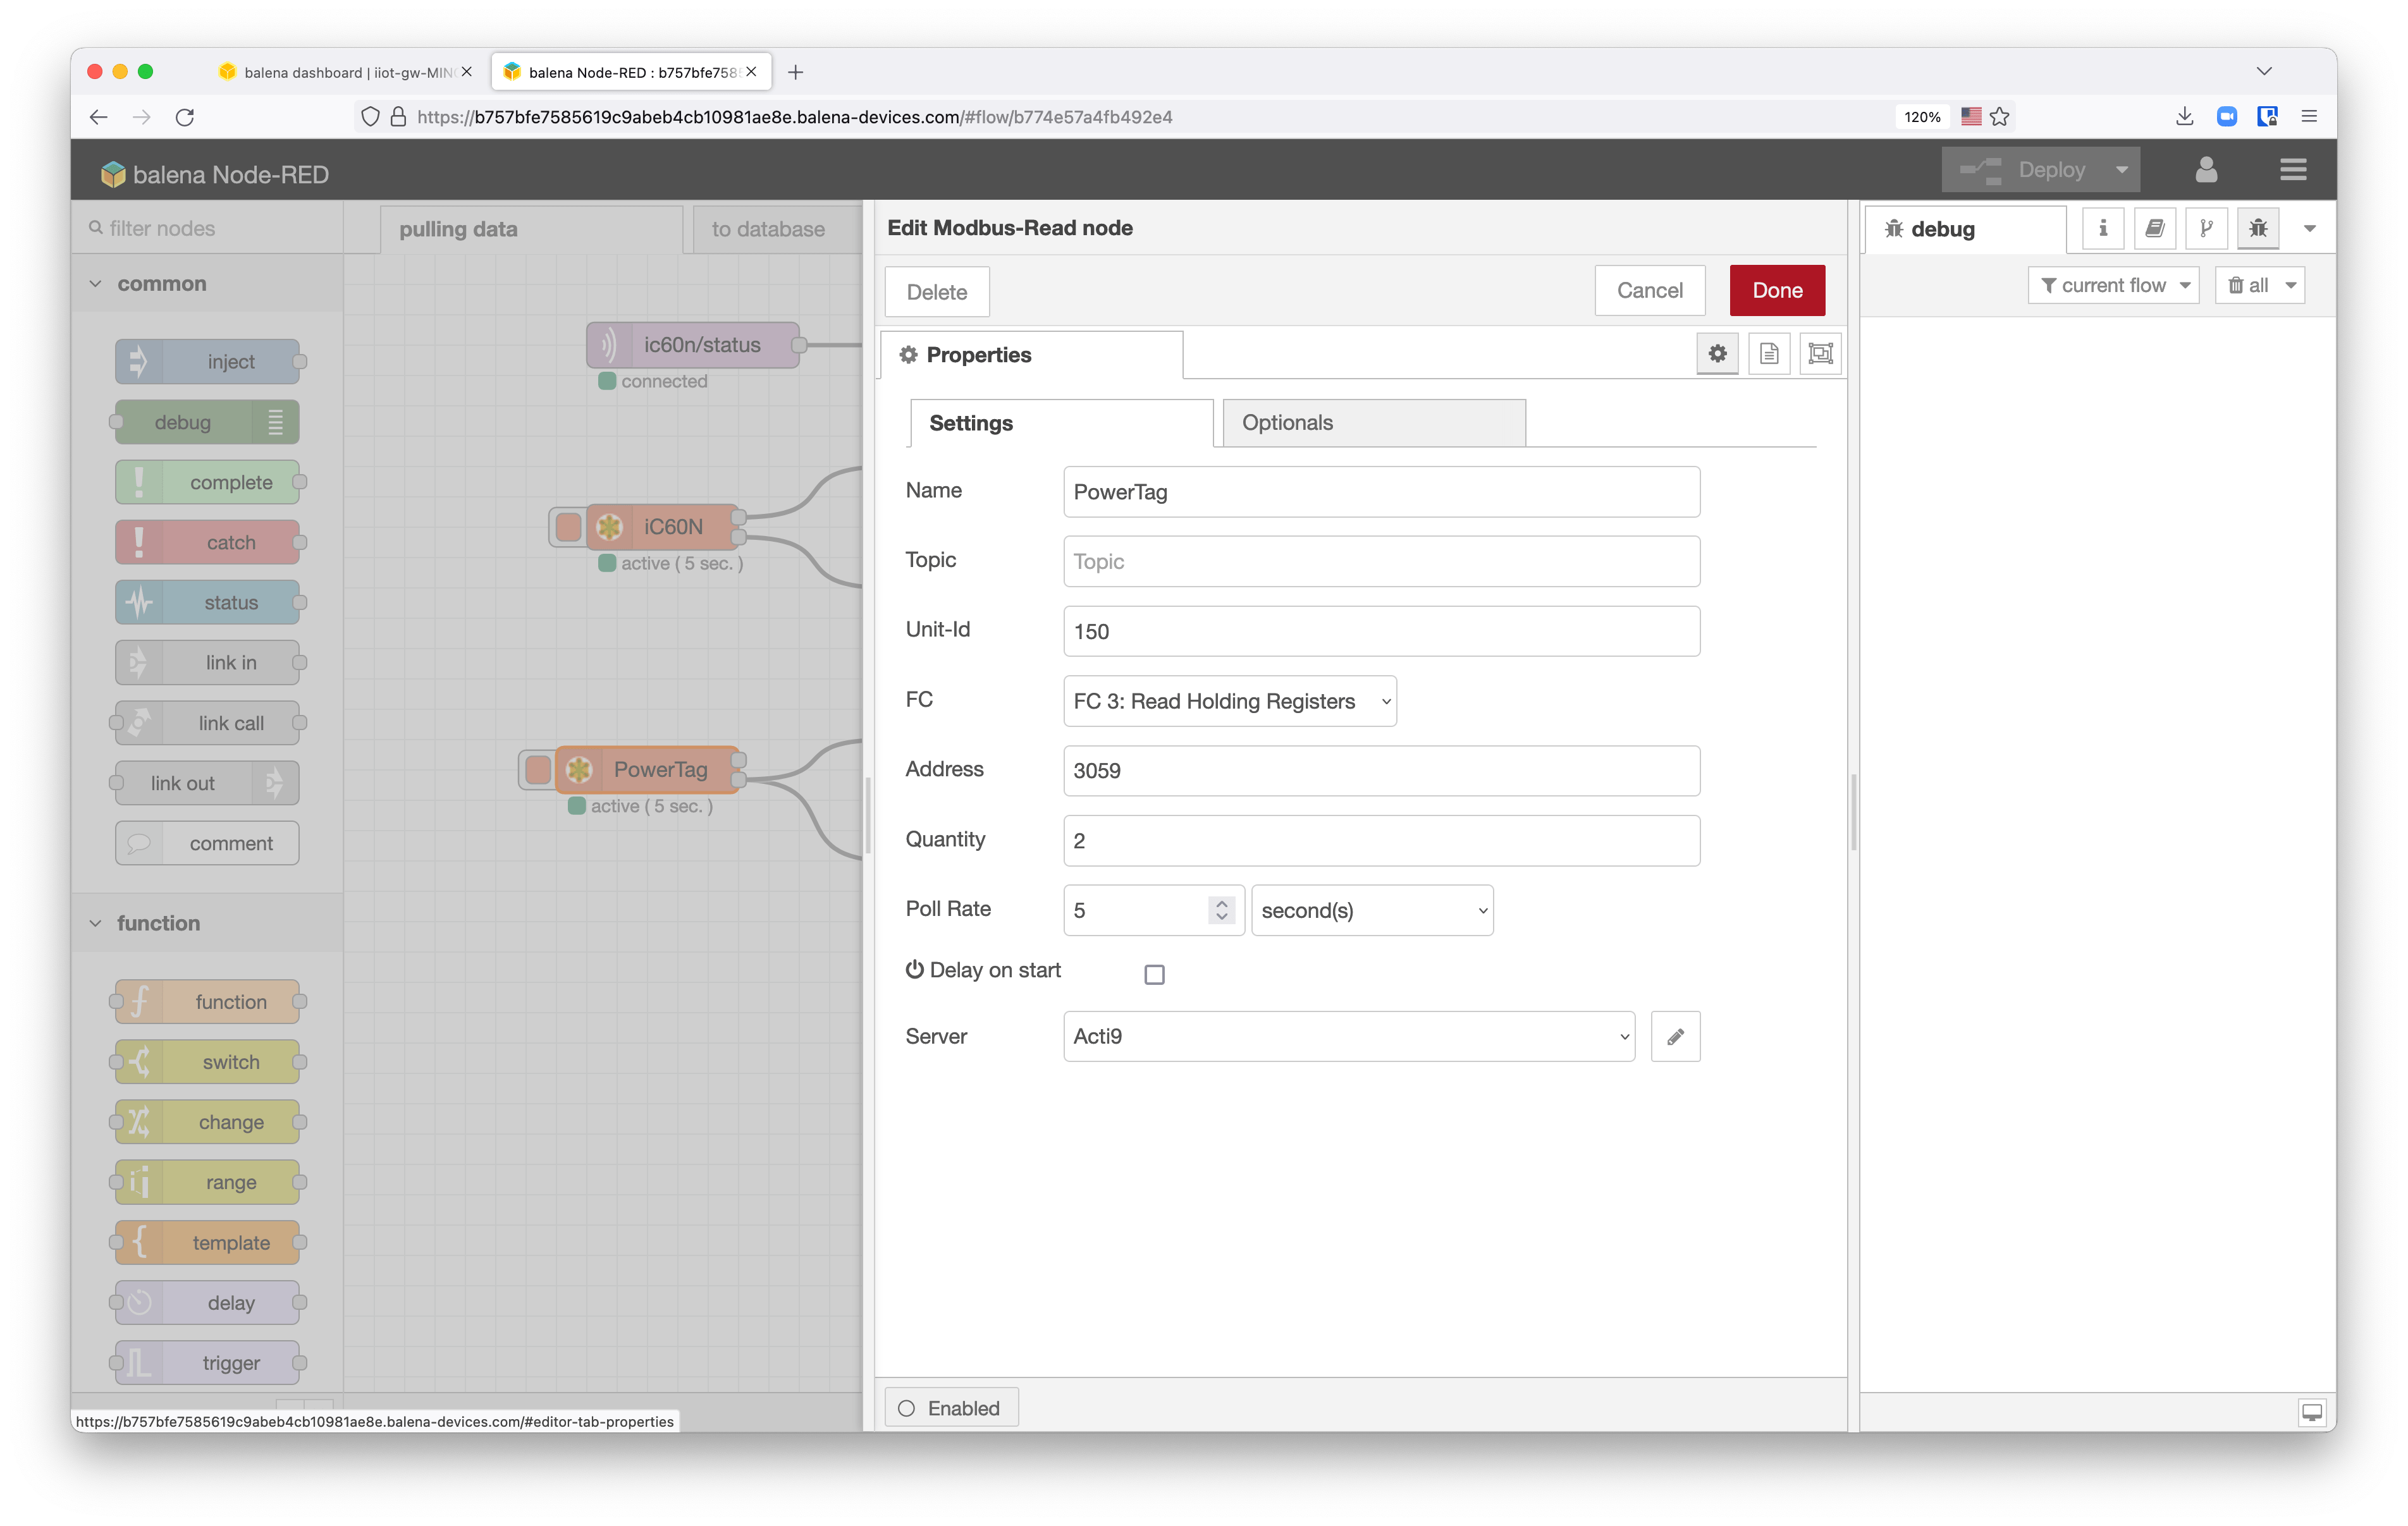
Registering the Modbus-Read node it’s important to know the register Address of the node (check the manual for the information) and the Quantity that you might need to read. In the previous example, 2 bytes of information. Remember that the minimum address is 1 byte, that means that if you need to read 1 bit, you need to read 1 byte anyway. Finally, introduce the Poll Rate that the system is going to read the Modbus registers.
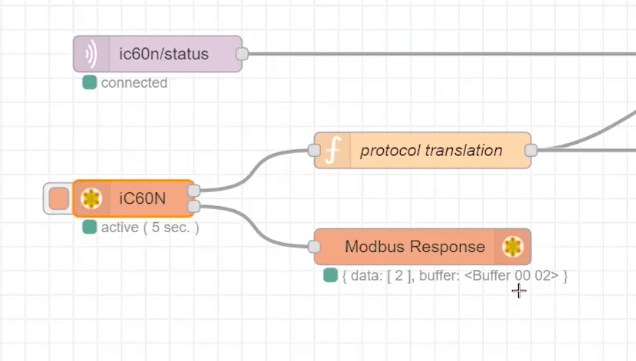
Add a Modbus Response node on your flow to visualize the data that we have received. In the previous screenshot we can see that we received a buffer with 0x002 as data. We also added a function node (protocol translation) with a javascript code that says that the circuit is closed when data is 3 and open otherwise. The data is published on the MQTT node (ic60n/status).
Remember that the MQTT broker will be the events central messaging system of your new industrial IoT ecosystem. The main goal of this is to use the MQTT broker as a Unified Namespace System. The Namespace is the system where you will be able to find all the data in real-time of all the legacy machinery and other elements that you have around the factory. Any element interested in the status of any other machine in the factory, instead of constantly reading the Modbus registry, can subscribe to the topic published and they will get automatically notified every time there is a change in that machine. That means, that we are moving the legacy machinery into an events-oriented architecture.
On NodeRED we have another flow that will manage the data. Instead of storing directly the data to the database from this flow, we are going to publish the data coming from the Modbus to a specific MQTT topic (e.g. ic60n/status). The second flow (to database) will subscribe to all these MQTT events and it will store the data into the database. We use a second flow on NodeRED to decouple the parts as much as you can. The two functionalities are not related. One is the data polling ingestion and the other is data storage.
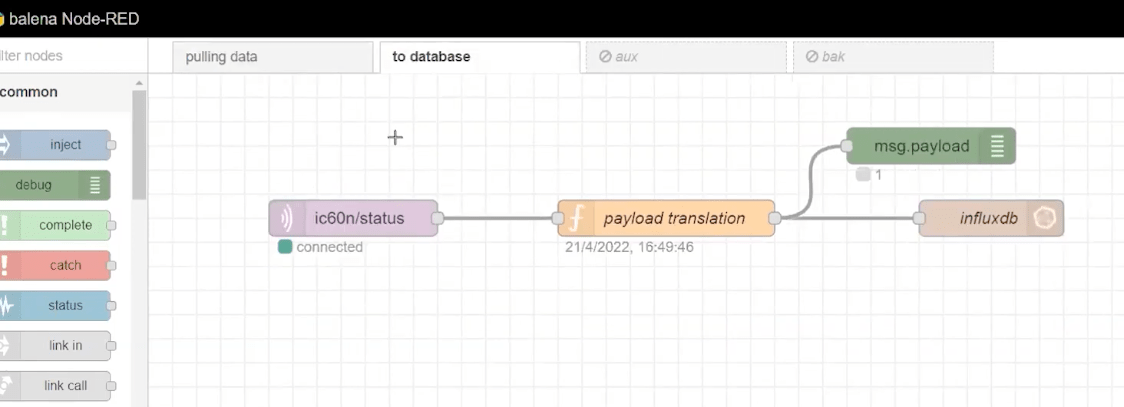
The MQTT node will be subscribed to the topic ic60n/status and will get notified in real-time. We will translate the message with a function node and finally we will store it using the InfluxDB node.
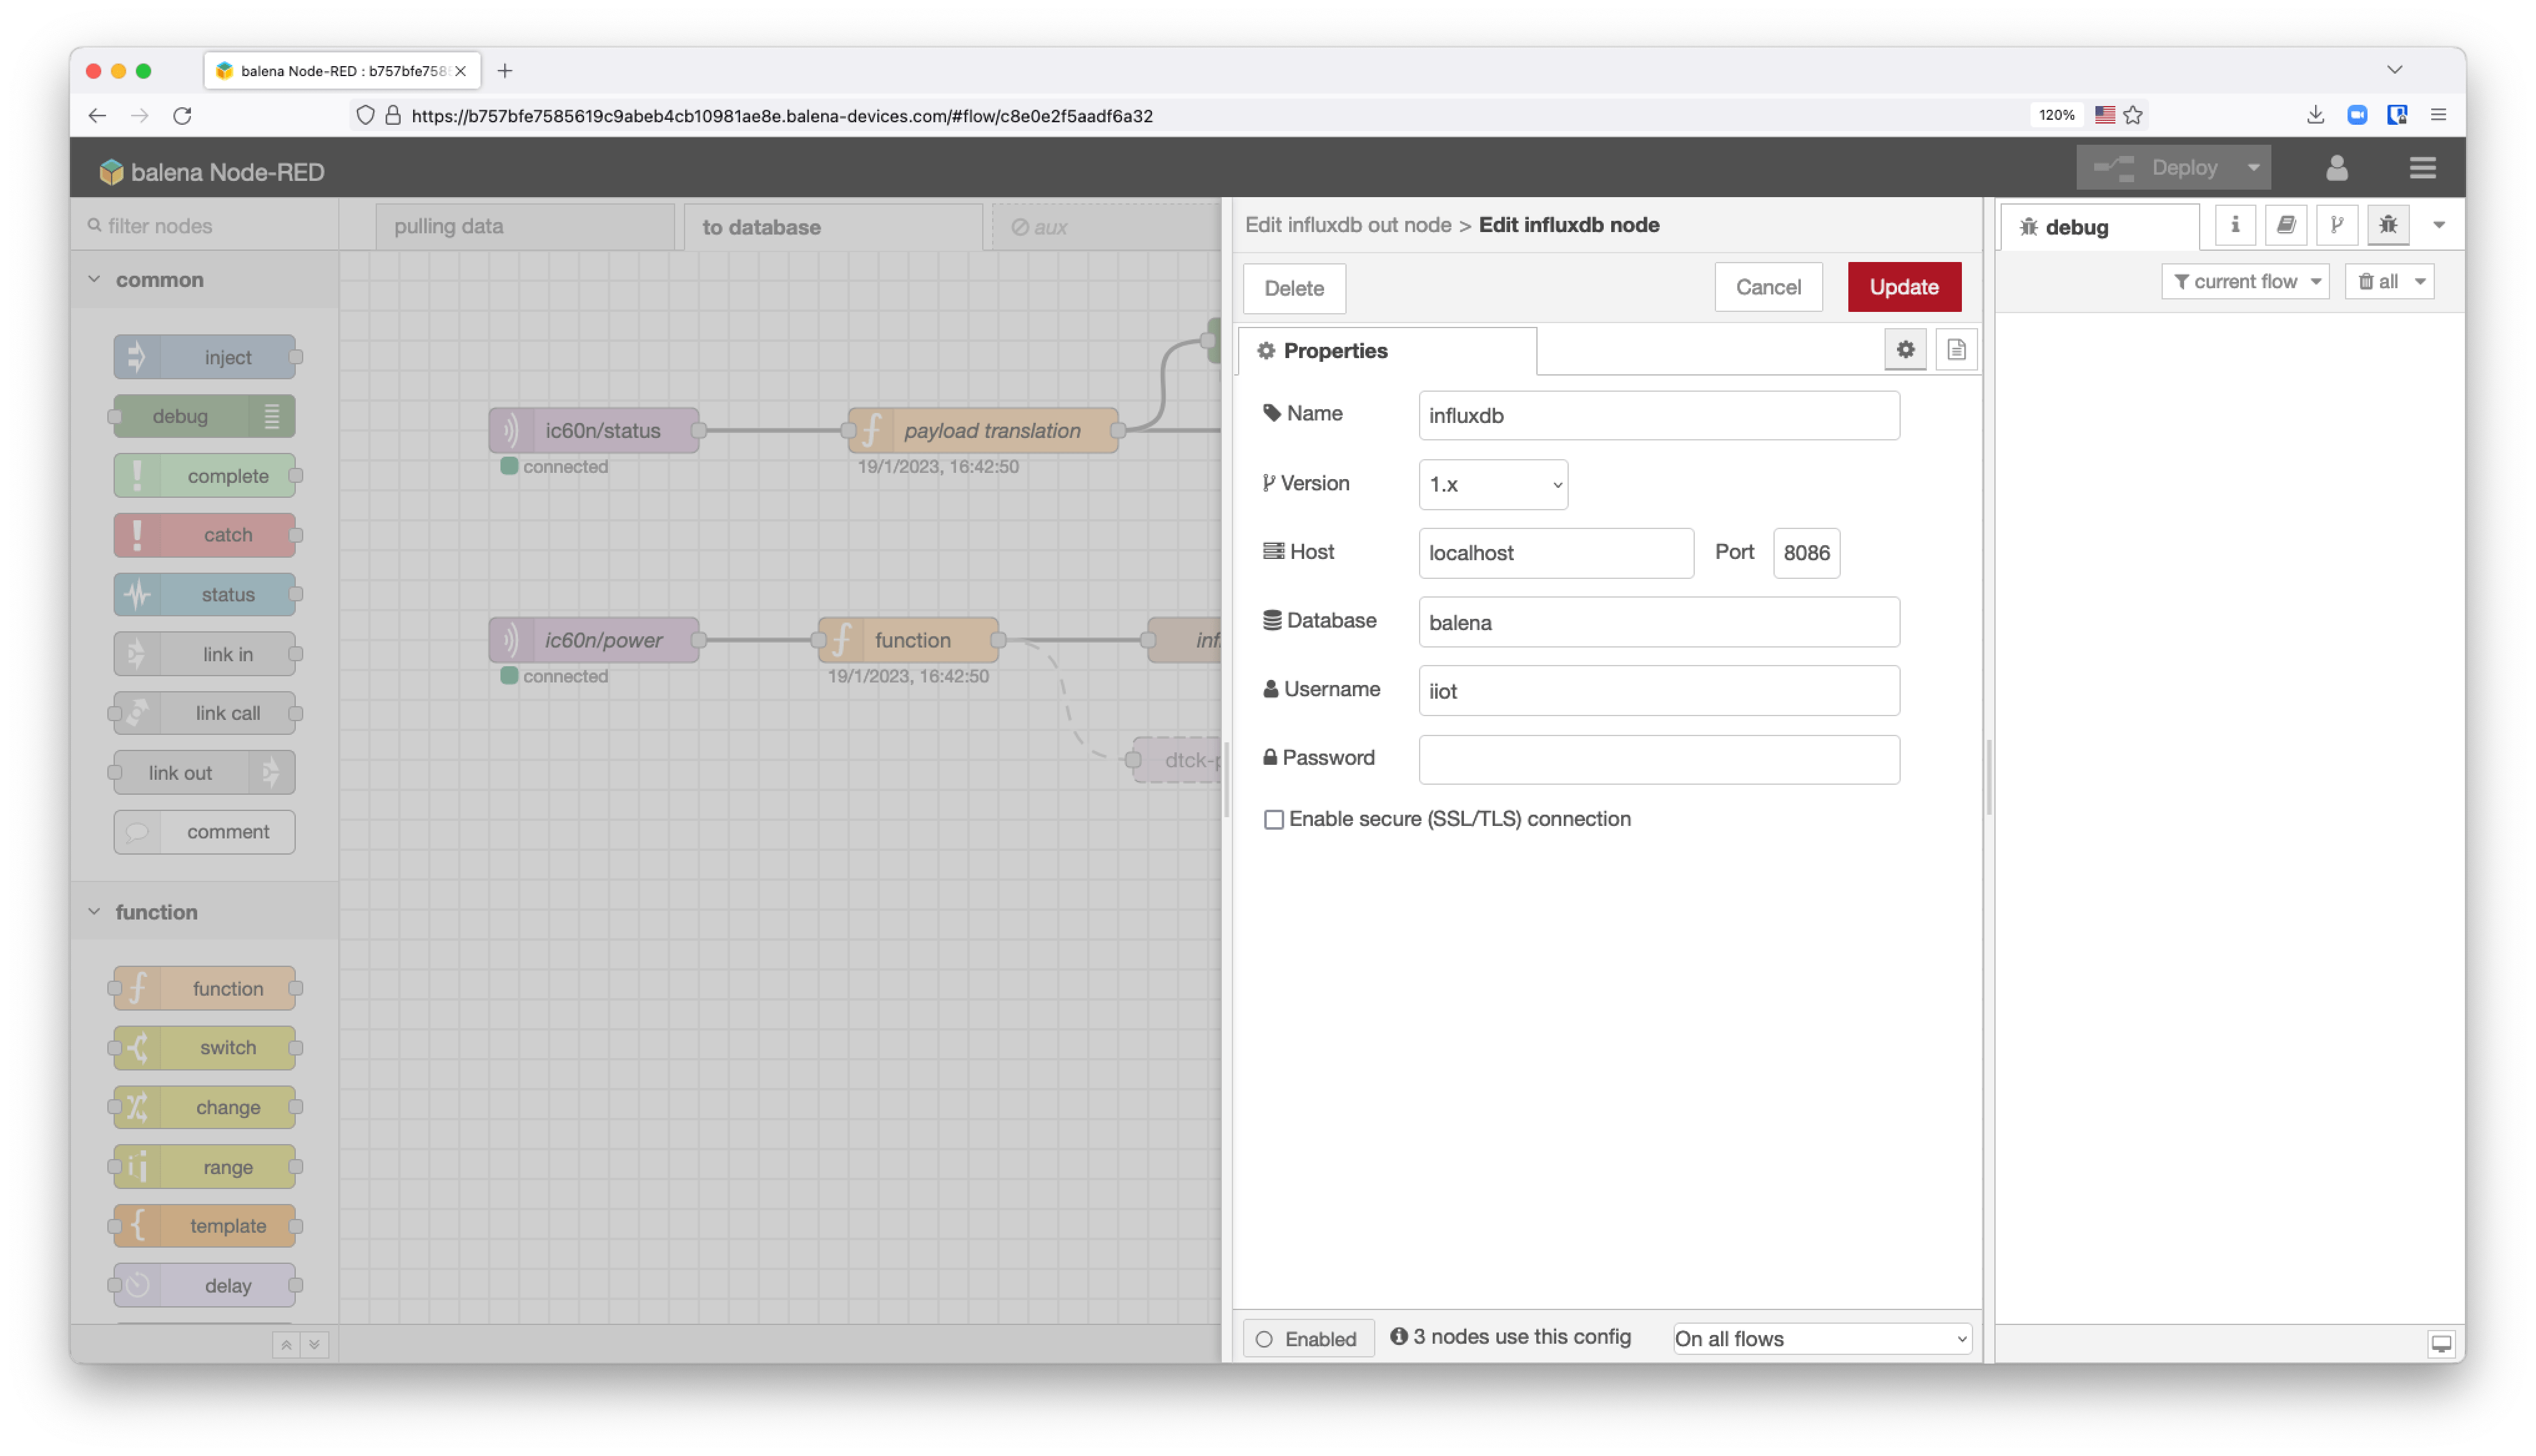
To configure the Influxdb node, edit the influxdb out nodeto the Host localhost and port 8086. The database is called balena and the username iiot. For security purposes, change the username and add a password to the database. The measurement will be the measurement status.
Add the Schneider Electric PowerTag on NodeRED
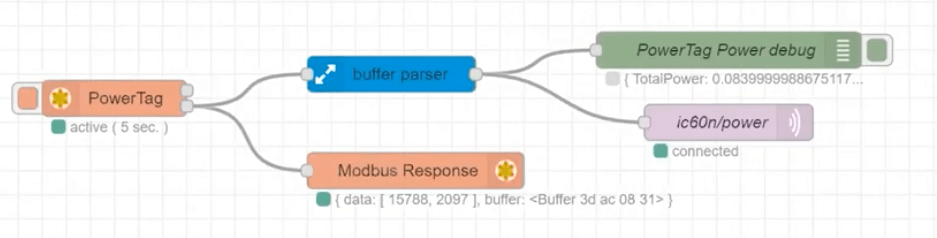
To add the Schneider Electric PowerTag flow on NodeRED, just add a Modbus Reader node on the first flow. Check on the Acti9 Smartlink manual the PowerTag Wireless Communication Energy Sensors Modbus tables to know the address where you can poll the data. In the Address 3059 you will be able to read the Total Active power that goes through the circuit breaker. We will need to read 2 bytes on Float32.

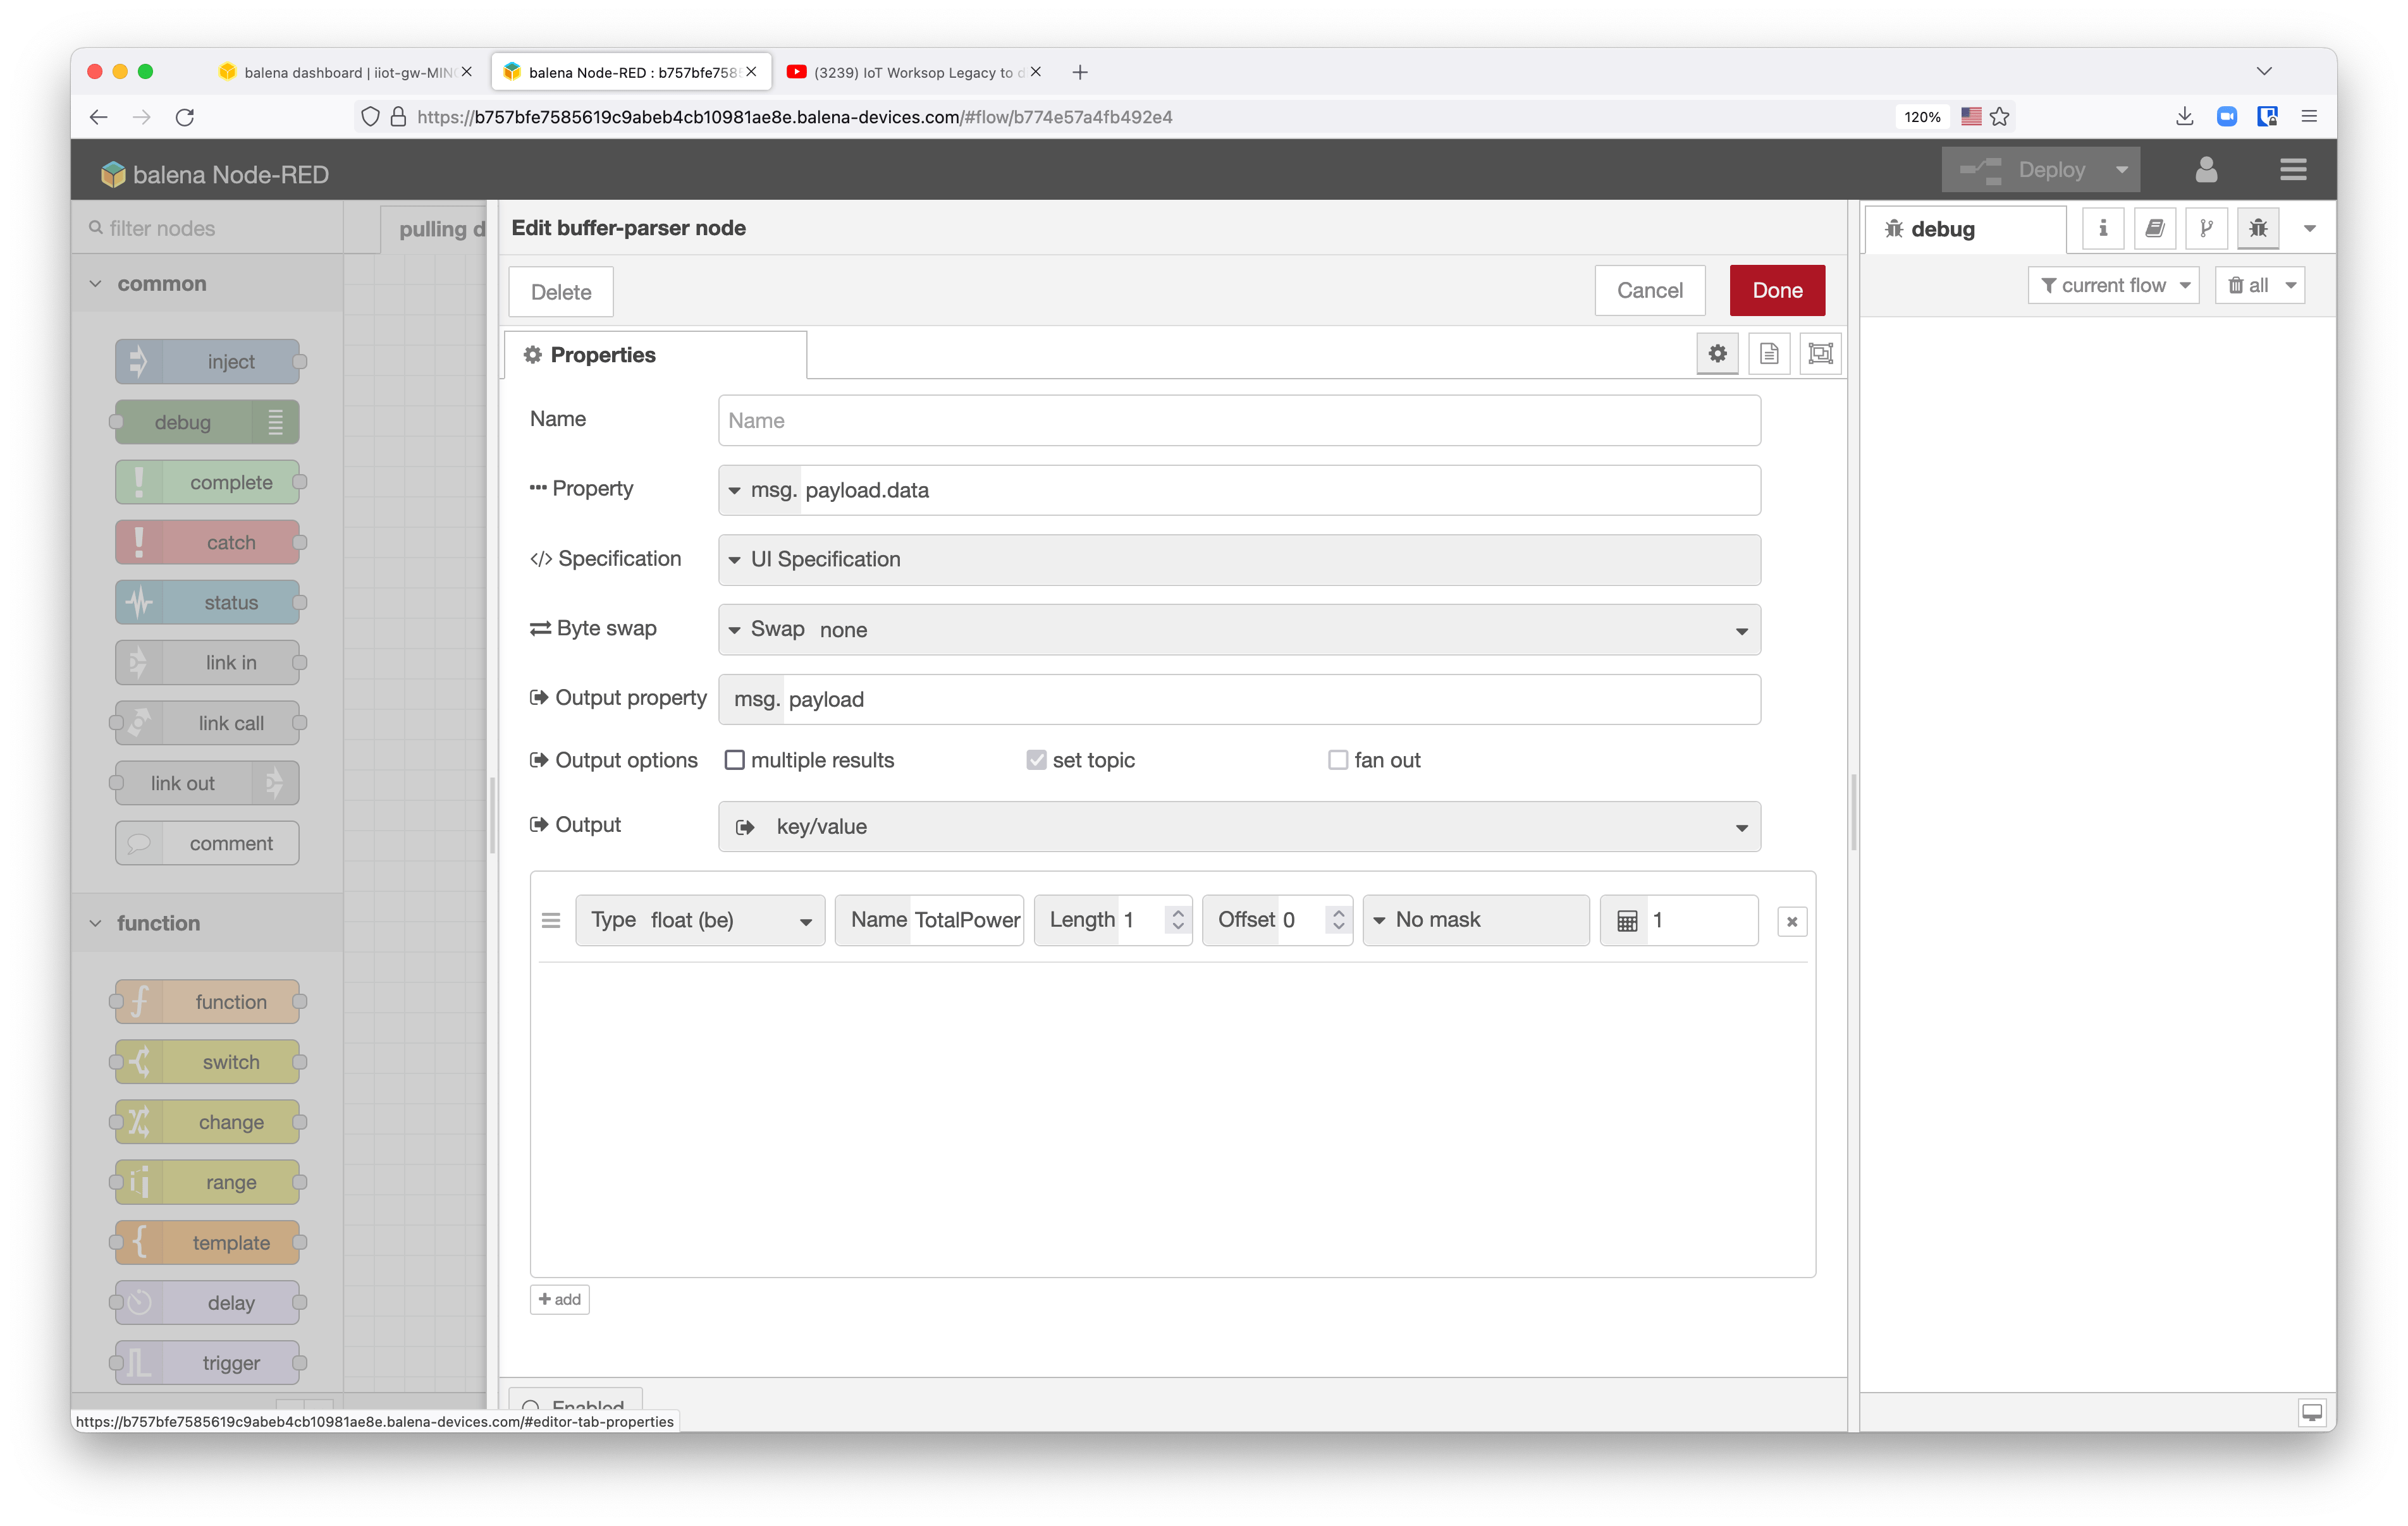
Once we have the data, we have to convert the hexadecimal reading from the Modbus register into Float32 data. Add a buffer-parser node to convert a buffer (float be) into a key/value items.
Add a change node to convert the payload of the message as only the data that you have on msg.payload.TotalPower to send the payload properly via MQTT.
It’s time to edit the second flow to store the data published on the MQTT broker into influxDB.
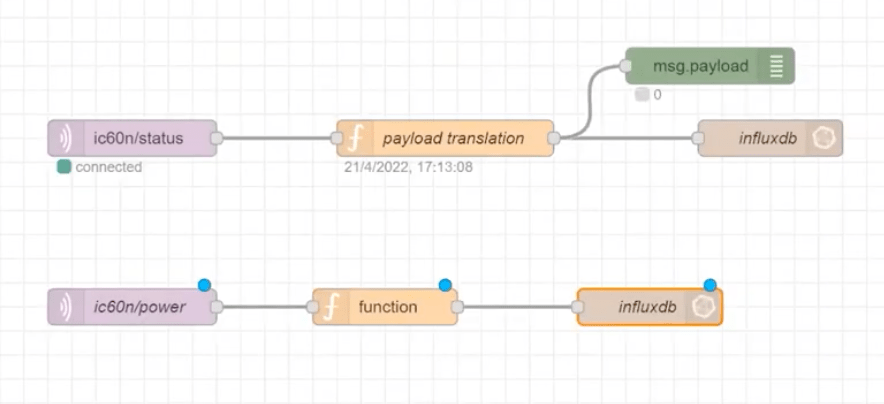
In the second flow of NodeRED there are now two MQTT subscribers, one for each topic generated on the first flow. The MQTT elements are waiting for data to be published. Once the data is published, it will be transformed and stored on the local Influx database in the edge.
Visualize industrial data with Grafana in the edge
Getting the advantage of the MING stack (MQTT, InfluxDB, NodeRED and Grafana), it’s really simple to visualize the data stored on InfluxDB on Grafana dashboards. The default datasource of the Grafana dashboards is the InfluxDB database, which enables you to quickly populate dashboards to visualize the data from your factory.
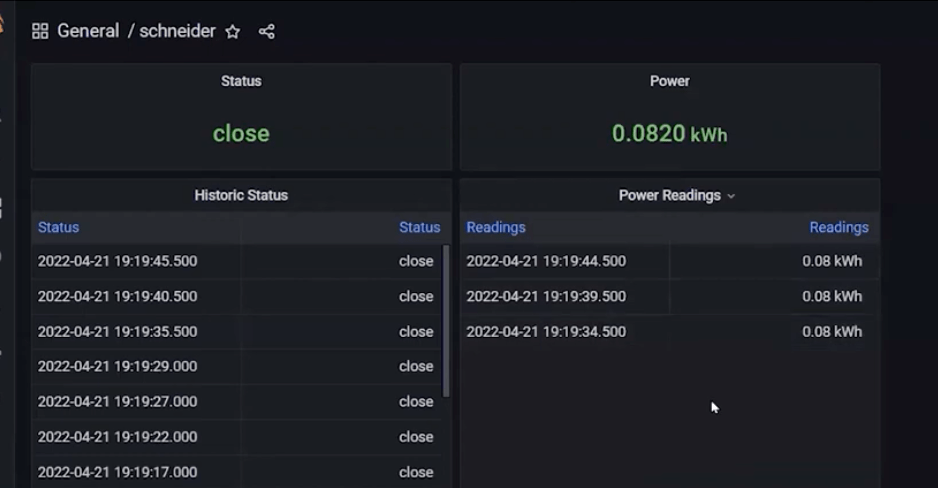
From here feel free to add more visualizations on your dashboard.
Security
Isolate the network of your legacy devices
Modbus don’t bring any security protection to read or write on their addresses. That means that anyone with access to the network where you have Modbus devices can read and write the registries.
The first recommendation is to try to isolate Modbus TCP devices in their own networks. Plus do not share TCP/IP addresses with the rest of the devices of the factory.
In the example we showed before, the company network is 10.2.0.198 and the address of the network of the IoT gateway and Modbus devices is under 10.46.1.x for example. This is a completely different network that nobody can access there.
Other industrial protocols such as OPC/UA currently solve this security problem. That means, that one recommendation is to avoid to add new Modbus devices on your factory, and if you do, isolate the network where they are connected.
balenaHub
You can find the Industrial IoT Gateway with the MING stack on balenaHub, the balena marketplace platform for finding applications and blocks.
Feedback
The balena platform is all about reducing friction for fleet owners. If you use a different Modbus Master, please do go to the manual to learn the addresses of the Modbus registers. As always, let us know if you run into any issues when following this guide or getting the Industrial IoT gateway set up in your factory or industry.
Feel free to add a comment below or contact us on our forums.