
In this blogpost, we are going to describe a reference architecture for deploying an open-source Industrial IoT edge gateway. This pretends to be a reference application that you can clone and deploy to accelerate the digitalization of your industry. With this Industrial IoT gateway running on the edge you can augment any industry and digitalize the plant floor, acquire data from multiple sources (e.g. Modbus, OPC UA or SCADA among others) and expose this data through an MQTT broker to multiple services in the edge.
If you would like to learn more about other Industrial IoT gateways we built with balena, feel free to read the previous blogpost showcasing how to digitalise a Modbus PLC with a balena edge gateway.
From Industry 3.0 to Industry 4.0
The Third Industrial Revolution (Industry 3.0) brought about many advances in manufacturing, including PLCs (Programmable Logic Controllers) and robotics. These technologies allowed companies to use highly automated production lines for greater efficiency in their manufacturing processes. However, traditional manufacturing systems are dedicated to performing specific tasks in siloed environments with little to no insight on how to use this data to automate entire business processes.
Industry 4.0 technologies allow you to take data from these disparate devices and applications in factory plant floor OT (Operational Technology) systems, contextualize it and integrate it with Advanced Analytics IT (Information Technology) systems. This enables you to derive insights that can help manufacturers make better decisions on how to improve production quality, reduce downtime and streamline business processes while meeting fast-changing market demands.
With access to low-cost IT tools and platforms in the cloud and at the edge, there is even greater opportunity for manufacturers to transform their business processes by adopting Industry 4.0 practices.
However, integrating data from the OT to the IT domain using traditional industrial architectures presents significant challenges. The first challenge is due to the hierarchical request-response architectural pattern that makes it complex to establish and maintain connections across multiple systems at scale. Instead, the new trends of the Industry 4.0 recommend implementing a publish-subscribe architecture pattern that uses MQTT brokers as the central hub to coordinate data exchange among sensors, machinery, enterprise applications, databases, and cloud analytics in real time. This leads to the concept of Unified Namespace (UNS) and the ISA95. The Unified Namespace is a middleware solution that allows you to collect data from IT and OT systems, add context to it, and transform it into a format that other systems can understand. The ISA95 is the most commonly used standard for modeling the data objects in the plant floor.
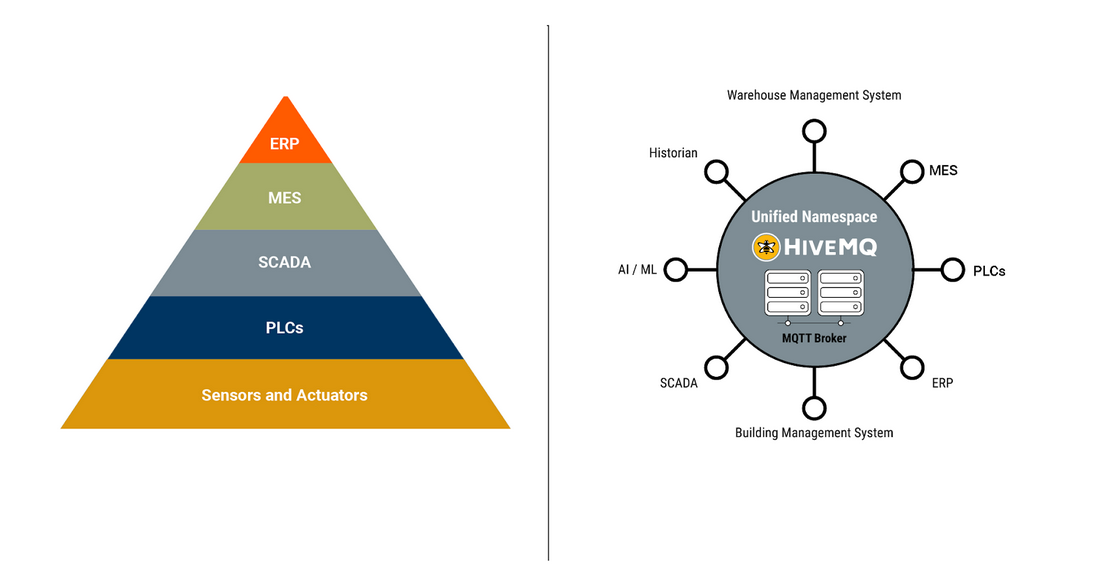
Instead of integrating all the layers of technology into upper layers, the main goal now is to use a publish/subscribe standard communication protocol that can be seamlessly integrated with the IT and OT systems. MQTT, as a publish-subscribe protocol is positioned to become the communication backbone among all the services and help to define the Unified Namespace. In future blog posts we are going to describe in more detail how to implement the Unified Namespace at the edge including tools such as Sparkplug B among others.
How to get data from the plant floor
The plant floor
Now that we have learned about the evolution from Industry 3.0 to Industry 4.0, the most important question is what is the easiest way to get the data out of your factory? At balena, we believe that the “secret sauce” for gathering all the data coming from different machines is to use an Industrial IoT Gateway at the edge.
Before demonstrating how to deploy and run the MING stack (MQTT, InfluxDB, NodeRED and Grafana) on an Industrial IoT Edge Gateway for OT to IT data integration, let’s discuss an example use case for production plant digitization that we will be building using the MING stack.
One of the most common industrial machines that you might need to get data from are air compressors, which use power to compress air. They are usually instrumented with parameters such as motor temperature, motor current and vibration that can be used as indicators for the health of the compressor. Accessing this data in real time could be useful for crucial IIoT applications such as remote monitoring and predictive maintenance to reduce the downtime of these critical machines in production lines.
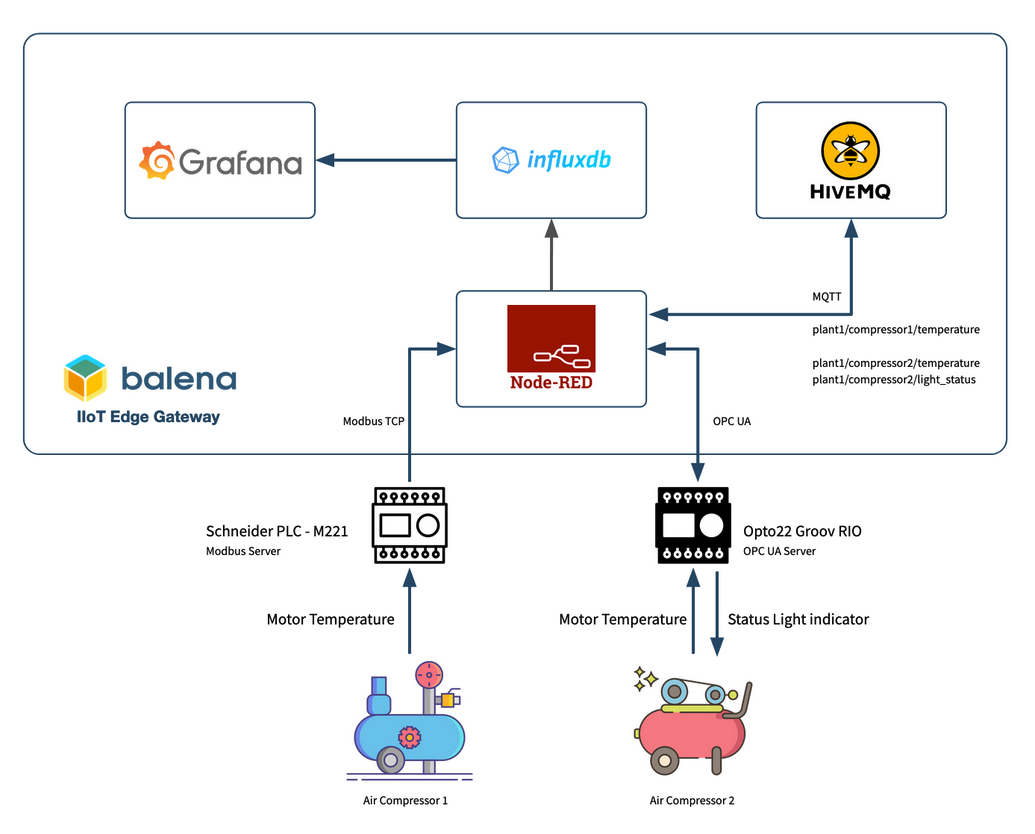
In this blogpost we are going to simulate two different air compressors using two different PLCs that have Modbus TCP and OPC UA communication interfaces. Both devices are connected to an OT network over Ethernet and have temperature sensors attached, generating air compressor data. We are then going to use the MING stack to build an IIoT application for monitoring and control of the Air Compressors.
Currently, most industrial machinery exposes data using communication protocols such as Modbus and OPC UA. The first step to access this data is to deploy connector modules that have the capability to extract data from your machinery to your IIoT gateway.
Next, the collected data needs to be contextualized as these could be just values with no metadata. Then the data needs to be converted into an IIoT protocol that makes it easy to integrate it with IT systems at the edge, and in the cloud when necessary. Some of the IT systems include time-series databases for storage, and interactive visualization platforms for analytics.
The MING stack
A leading trend for this pipeline is to use the MING stack: MQTT as an IIoT communication protocol, InfluxDB for time-series data storage, Node-Red for data collection and contextualisation, and Grafana for visualization and analytics.
The MING stack can reduce friction to achieve the mission of OT to IT data integration. Importantly, it enables you to convert your plant-floor data access mechanism into an event-driven system, in contrast to the request-response pattern typical with automation technologies used in production plants.
Moreover, an industrial IoT edge gateway using balena and Docker containers can support various applications and services running in parallel. In addition to running the MING stack, these services can provide insights about the performance and health of machines, optimize factory operations, reduce downtime, and improve product quality among others. Using Docker containers on edge gateways can enable the IT department to run secure services in parallel on single board computers.
By using the MING stack the edge gateway can enable interoperability between different devices and systems through the NodeRED service, and allow data to be collected with InfluxDB and visualized in real-time with Grafana, using MQTT as the connectivity backbone.
Edge Industrial IoT Gateway deployment
To reproduce the IIoT edge gateway deployment you will need:
Hardware needed
- Intel NUC (NUC10FNH)
- USB stick to flash the operating system of the Intel NUC.
- Ethernet cable with access to the plant floor communication network.
We are also using these industrial elements:
- Temperature Sensor connected to a Modbus Device
- Temperature Sensor connected to an OPC UA Device
- Signal Light connected to the same OPC UA device
Software setup
- A free balenaCloud account (sign up here). Remember: your first ten devices are free and fully-featured.
- Software to flash the Intel NUC computer. E.g. balenaEtcher
Deploy the Industrial IoT gateway application with HiveMQ and balena
Deploying this application is as simple as clicking the Deploy with balena button to create a fleet on balenaCloud. Find the repository of the application here.

balenaCloud
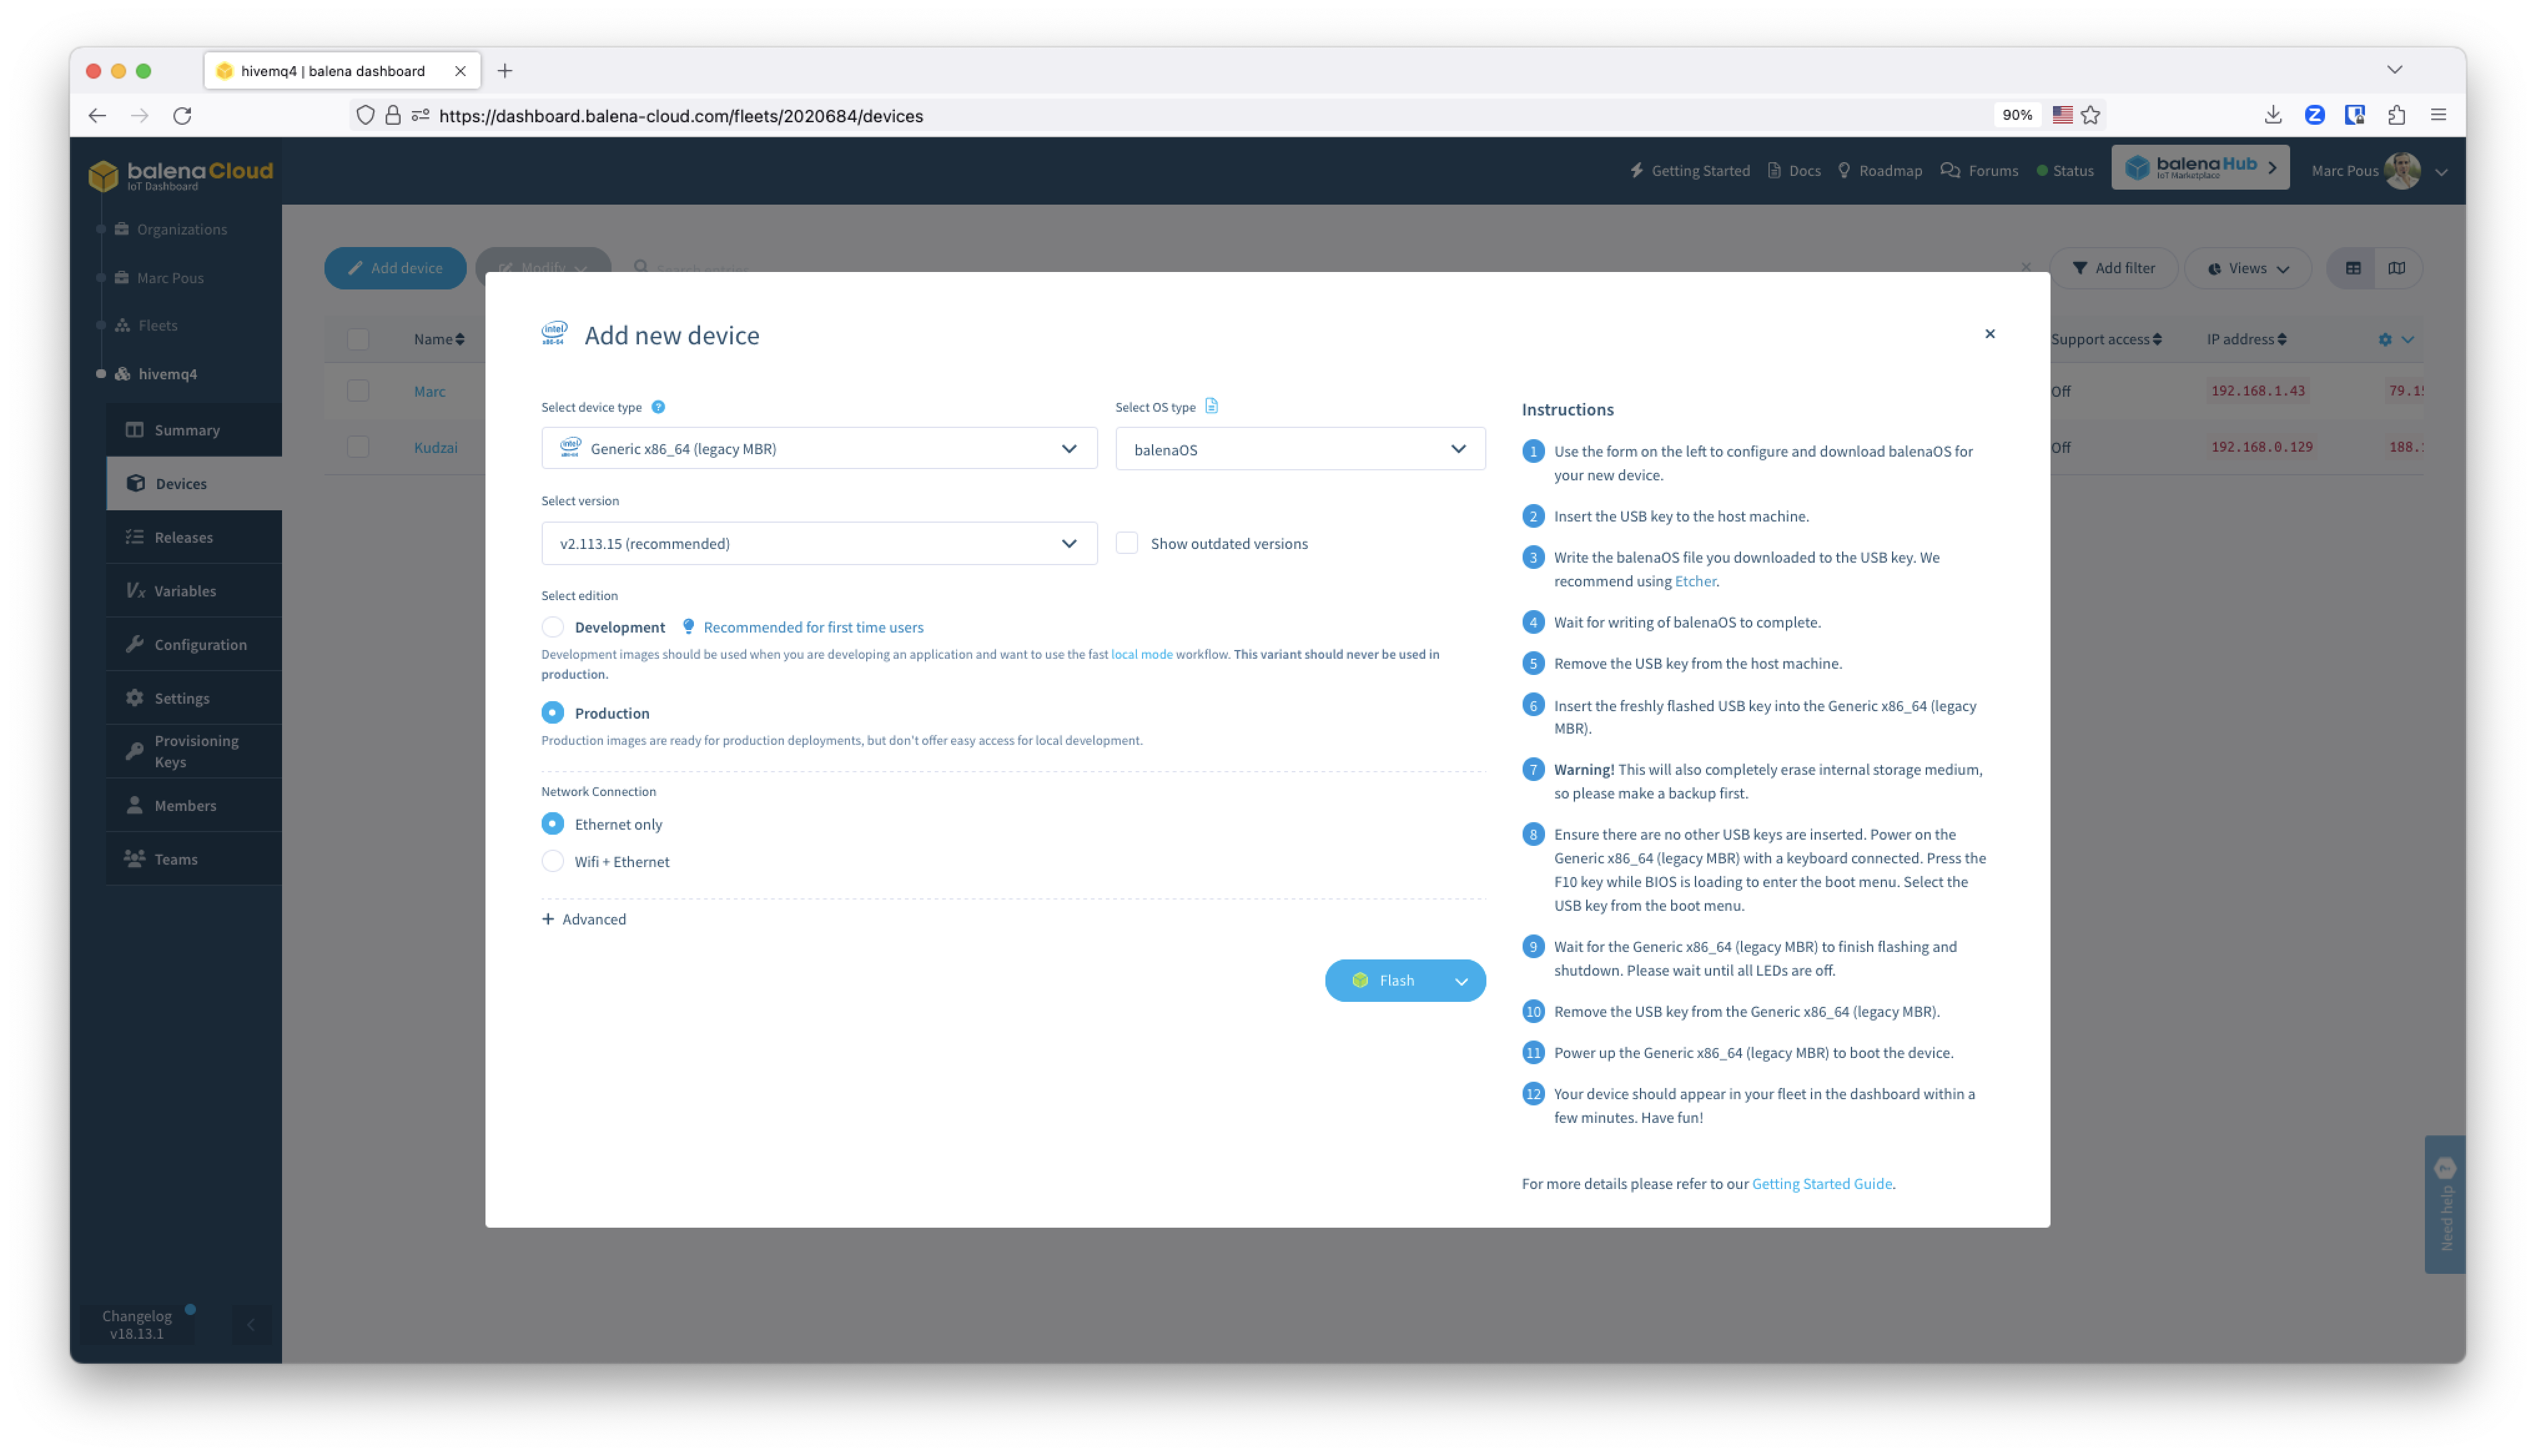
Follow the instructions, click Add a Device and flash a USB key with the balenaOS operating system image downloaded from balenaCloud using balenaEtcher.
Then insert the USB key into your Intel machine with a keyboard and the HDMI connected. Remember that this process will erase your internal storage drive, so if needed, make a backup first of the hard drive.
Power on the Intel machine and press F10 while the BIOS is loading to enter into the boot menu. Select the USB key from the boot menu. Wait until the device finishes flashing and shuts down. Once the LEDs are off, remove the USB key from the device and power it on again to boot the device with balenaOS. At this point, the device will deploy the latest release of the code from balenaCloud.
Go to balenaCloud to see when the device appears on-line.
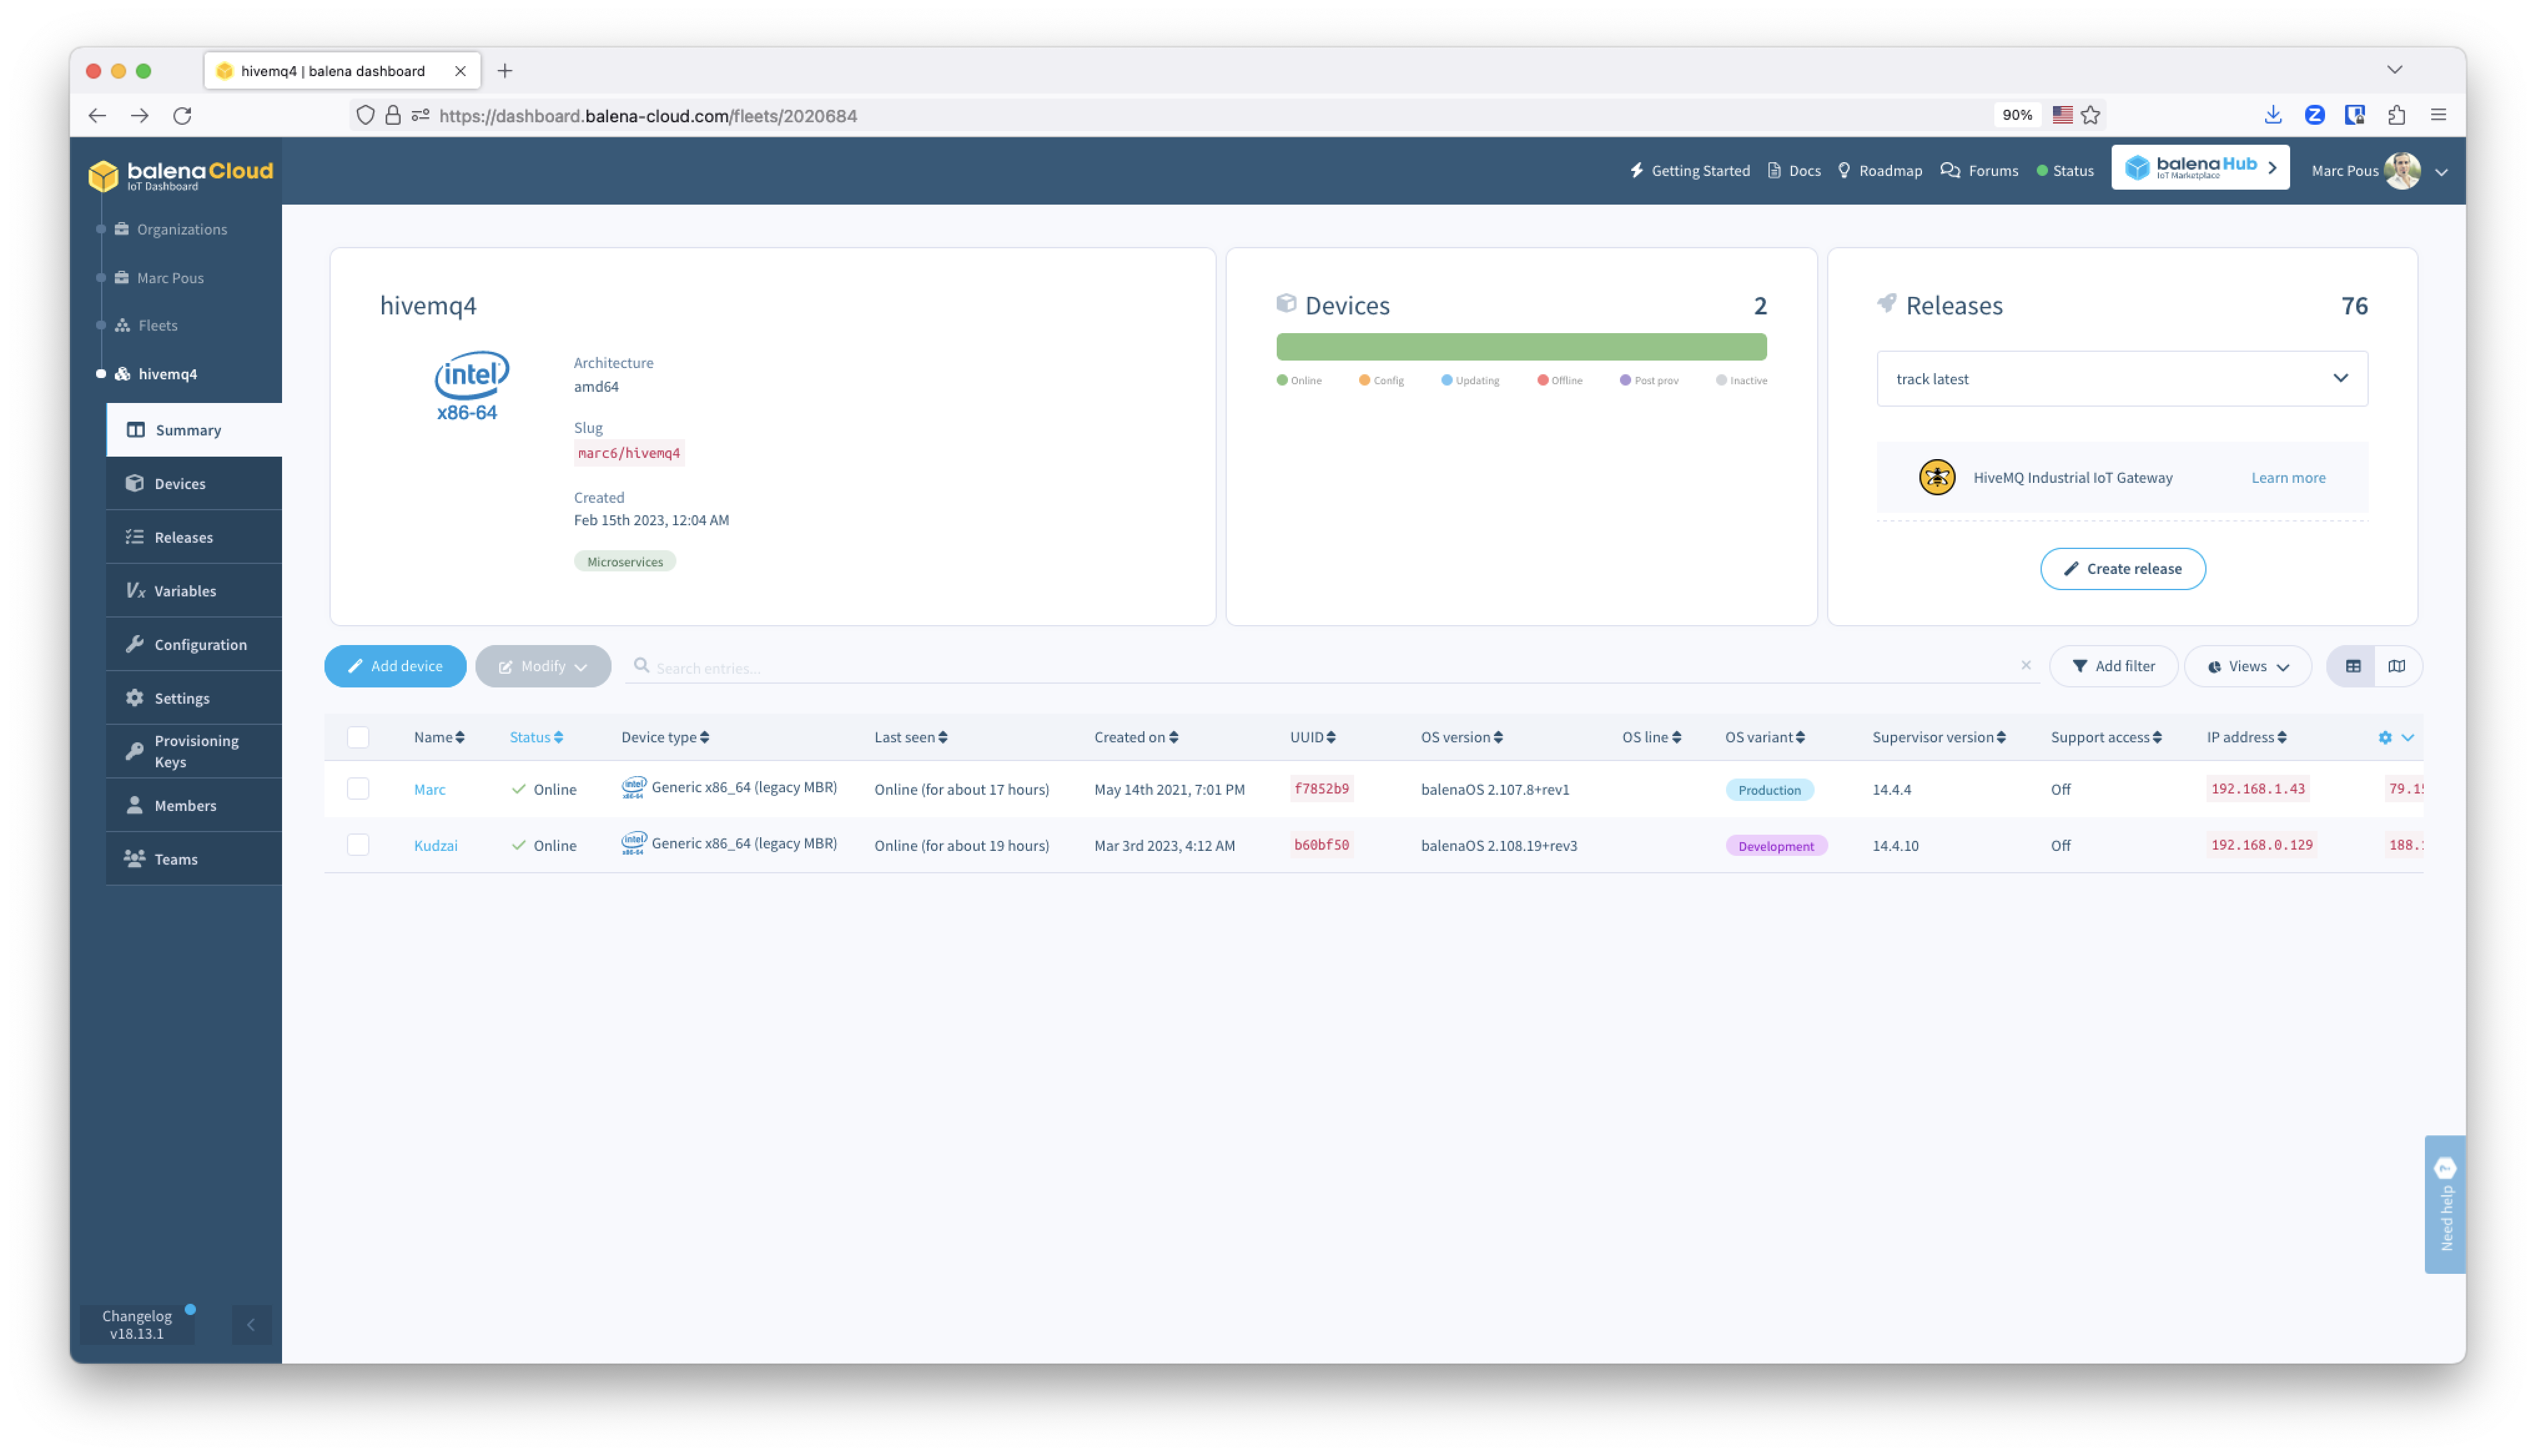
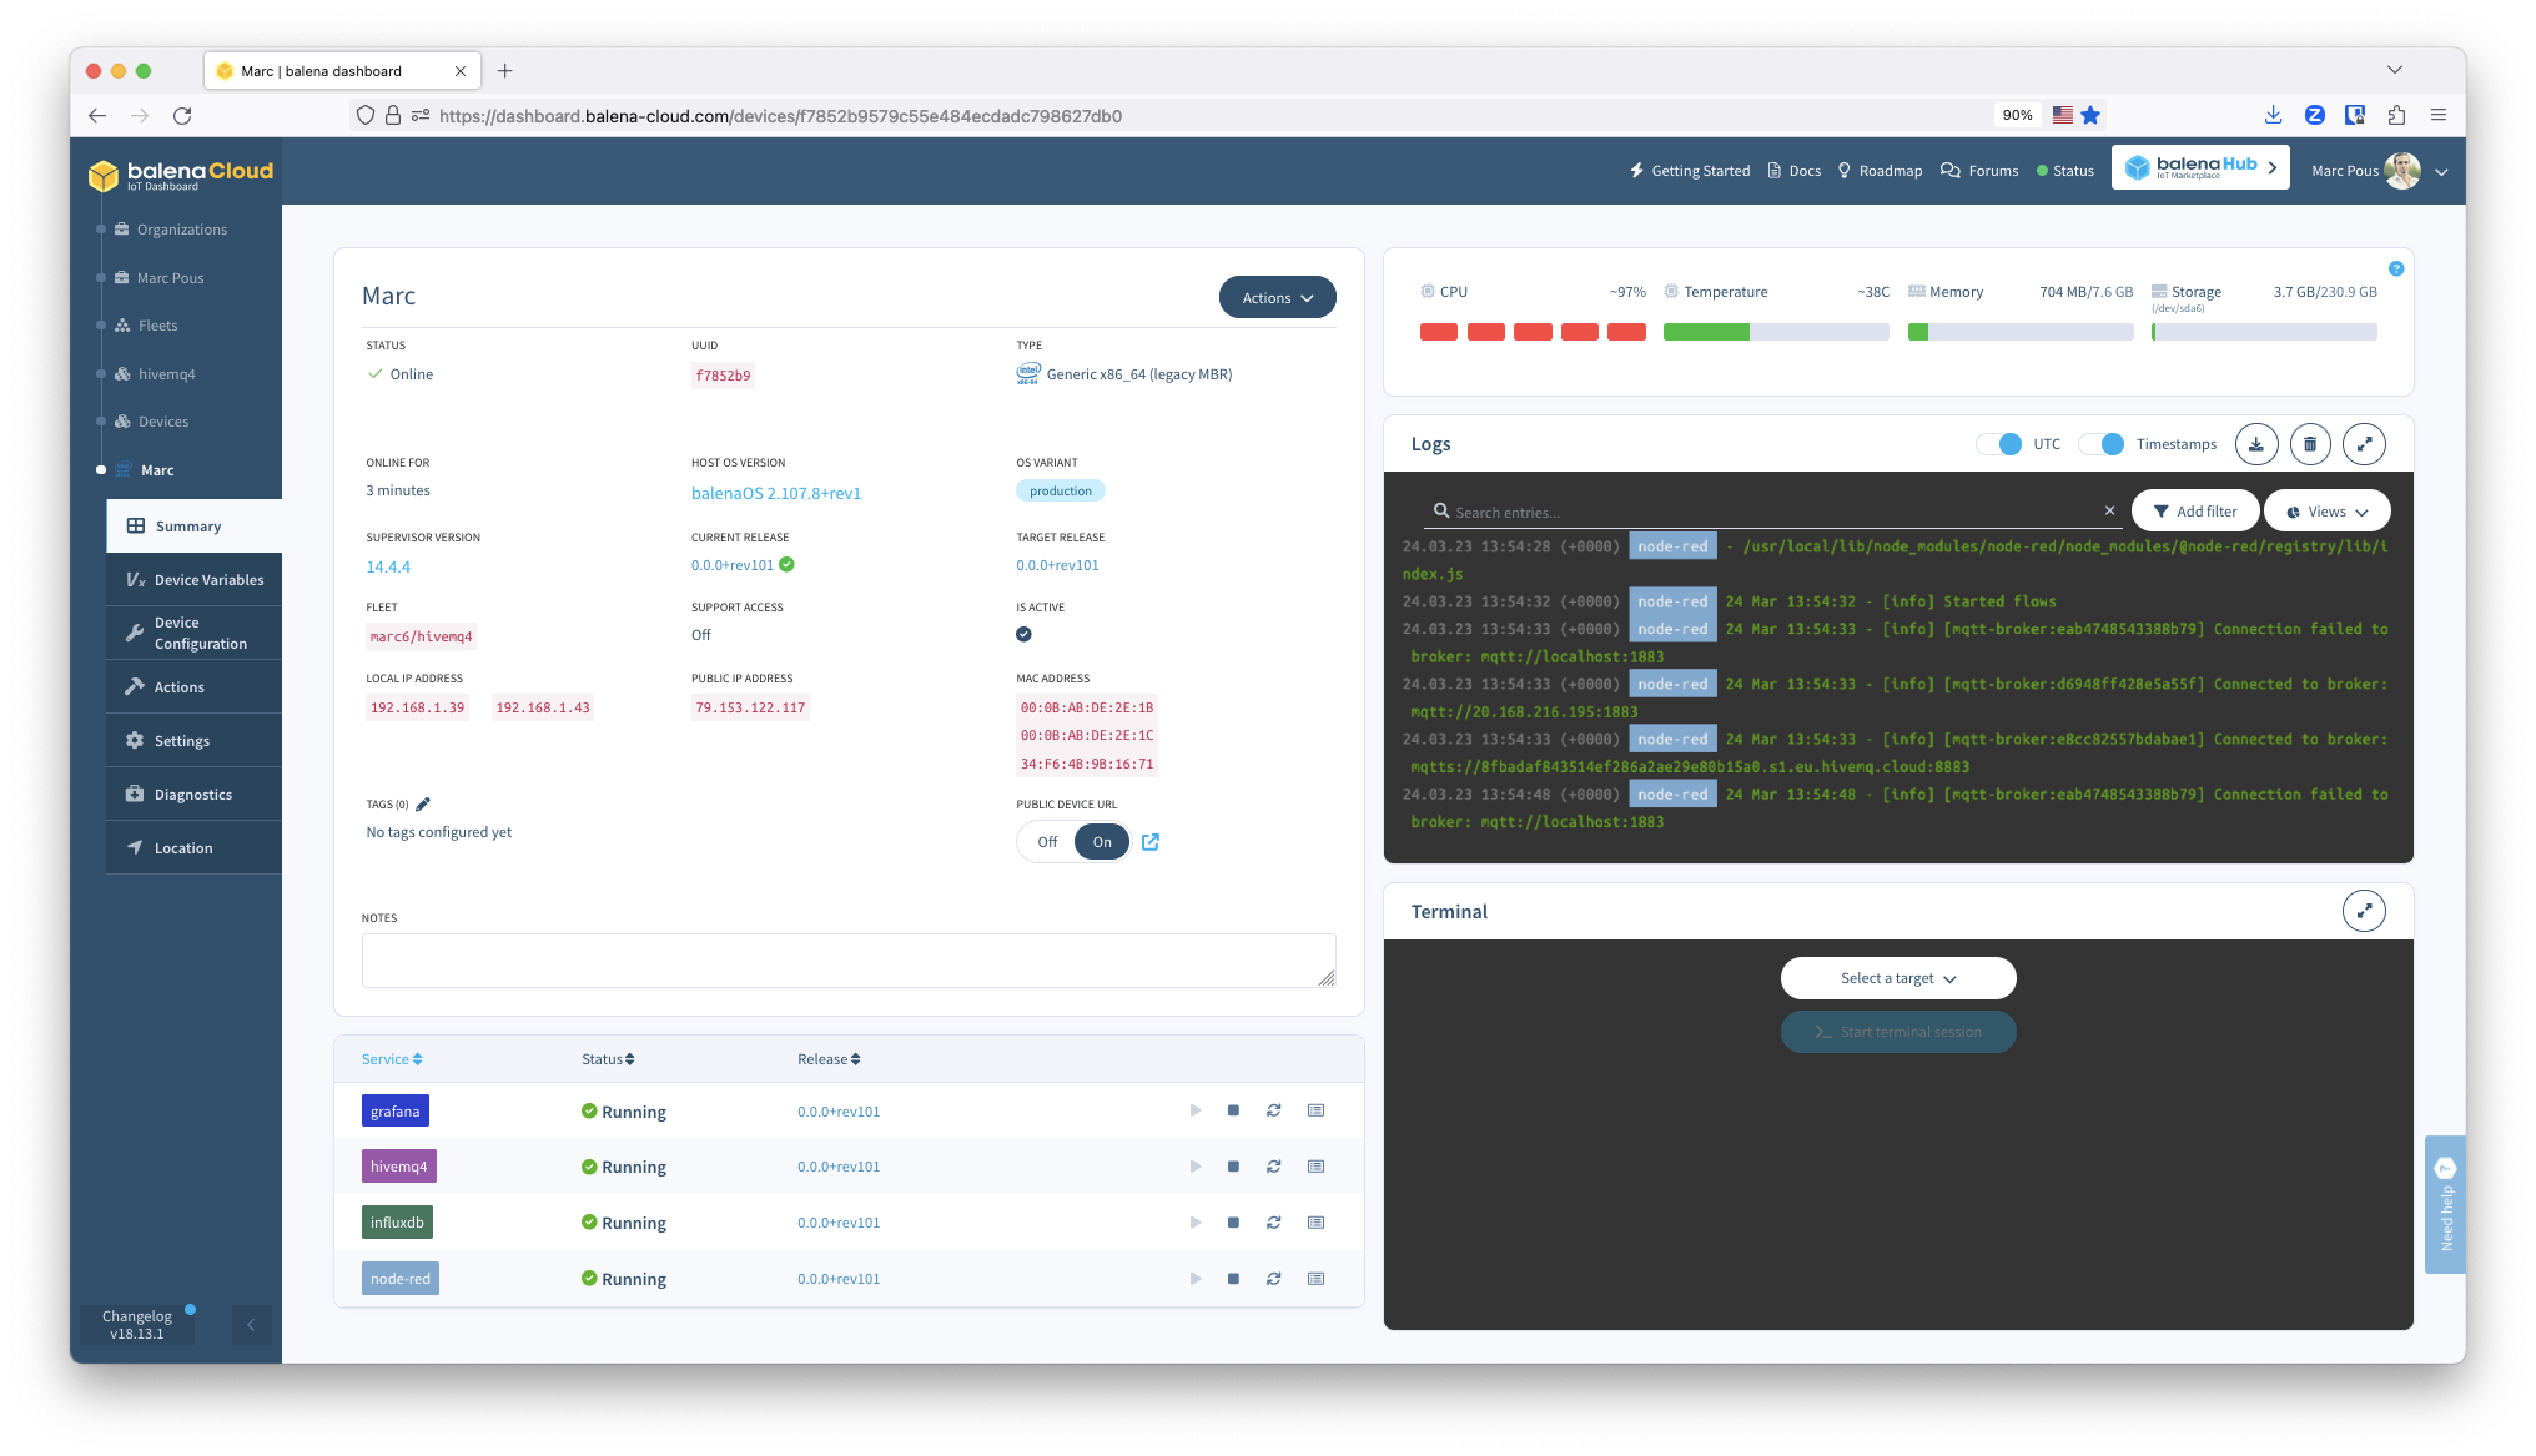
Click on your device and access the device summary.
HiveMQ
In this project we are going to use the Enterprise HiveMQ MQTT broker. The edge service of Enterprise HiveMQ can connect up to 25 devices or services to the HiveMQ MQTT broker for free. Enterprise extensions (which we will be using in a future post) are a premium feature which will work in the free version for five hours at a time, at which point you’ll need to restart the service. Alternatively you can use the HiveMQ community edition, which might work great for this project. Find a HiveMQ Community Edition application with balena here
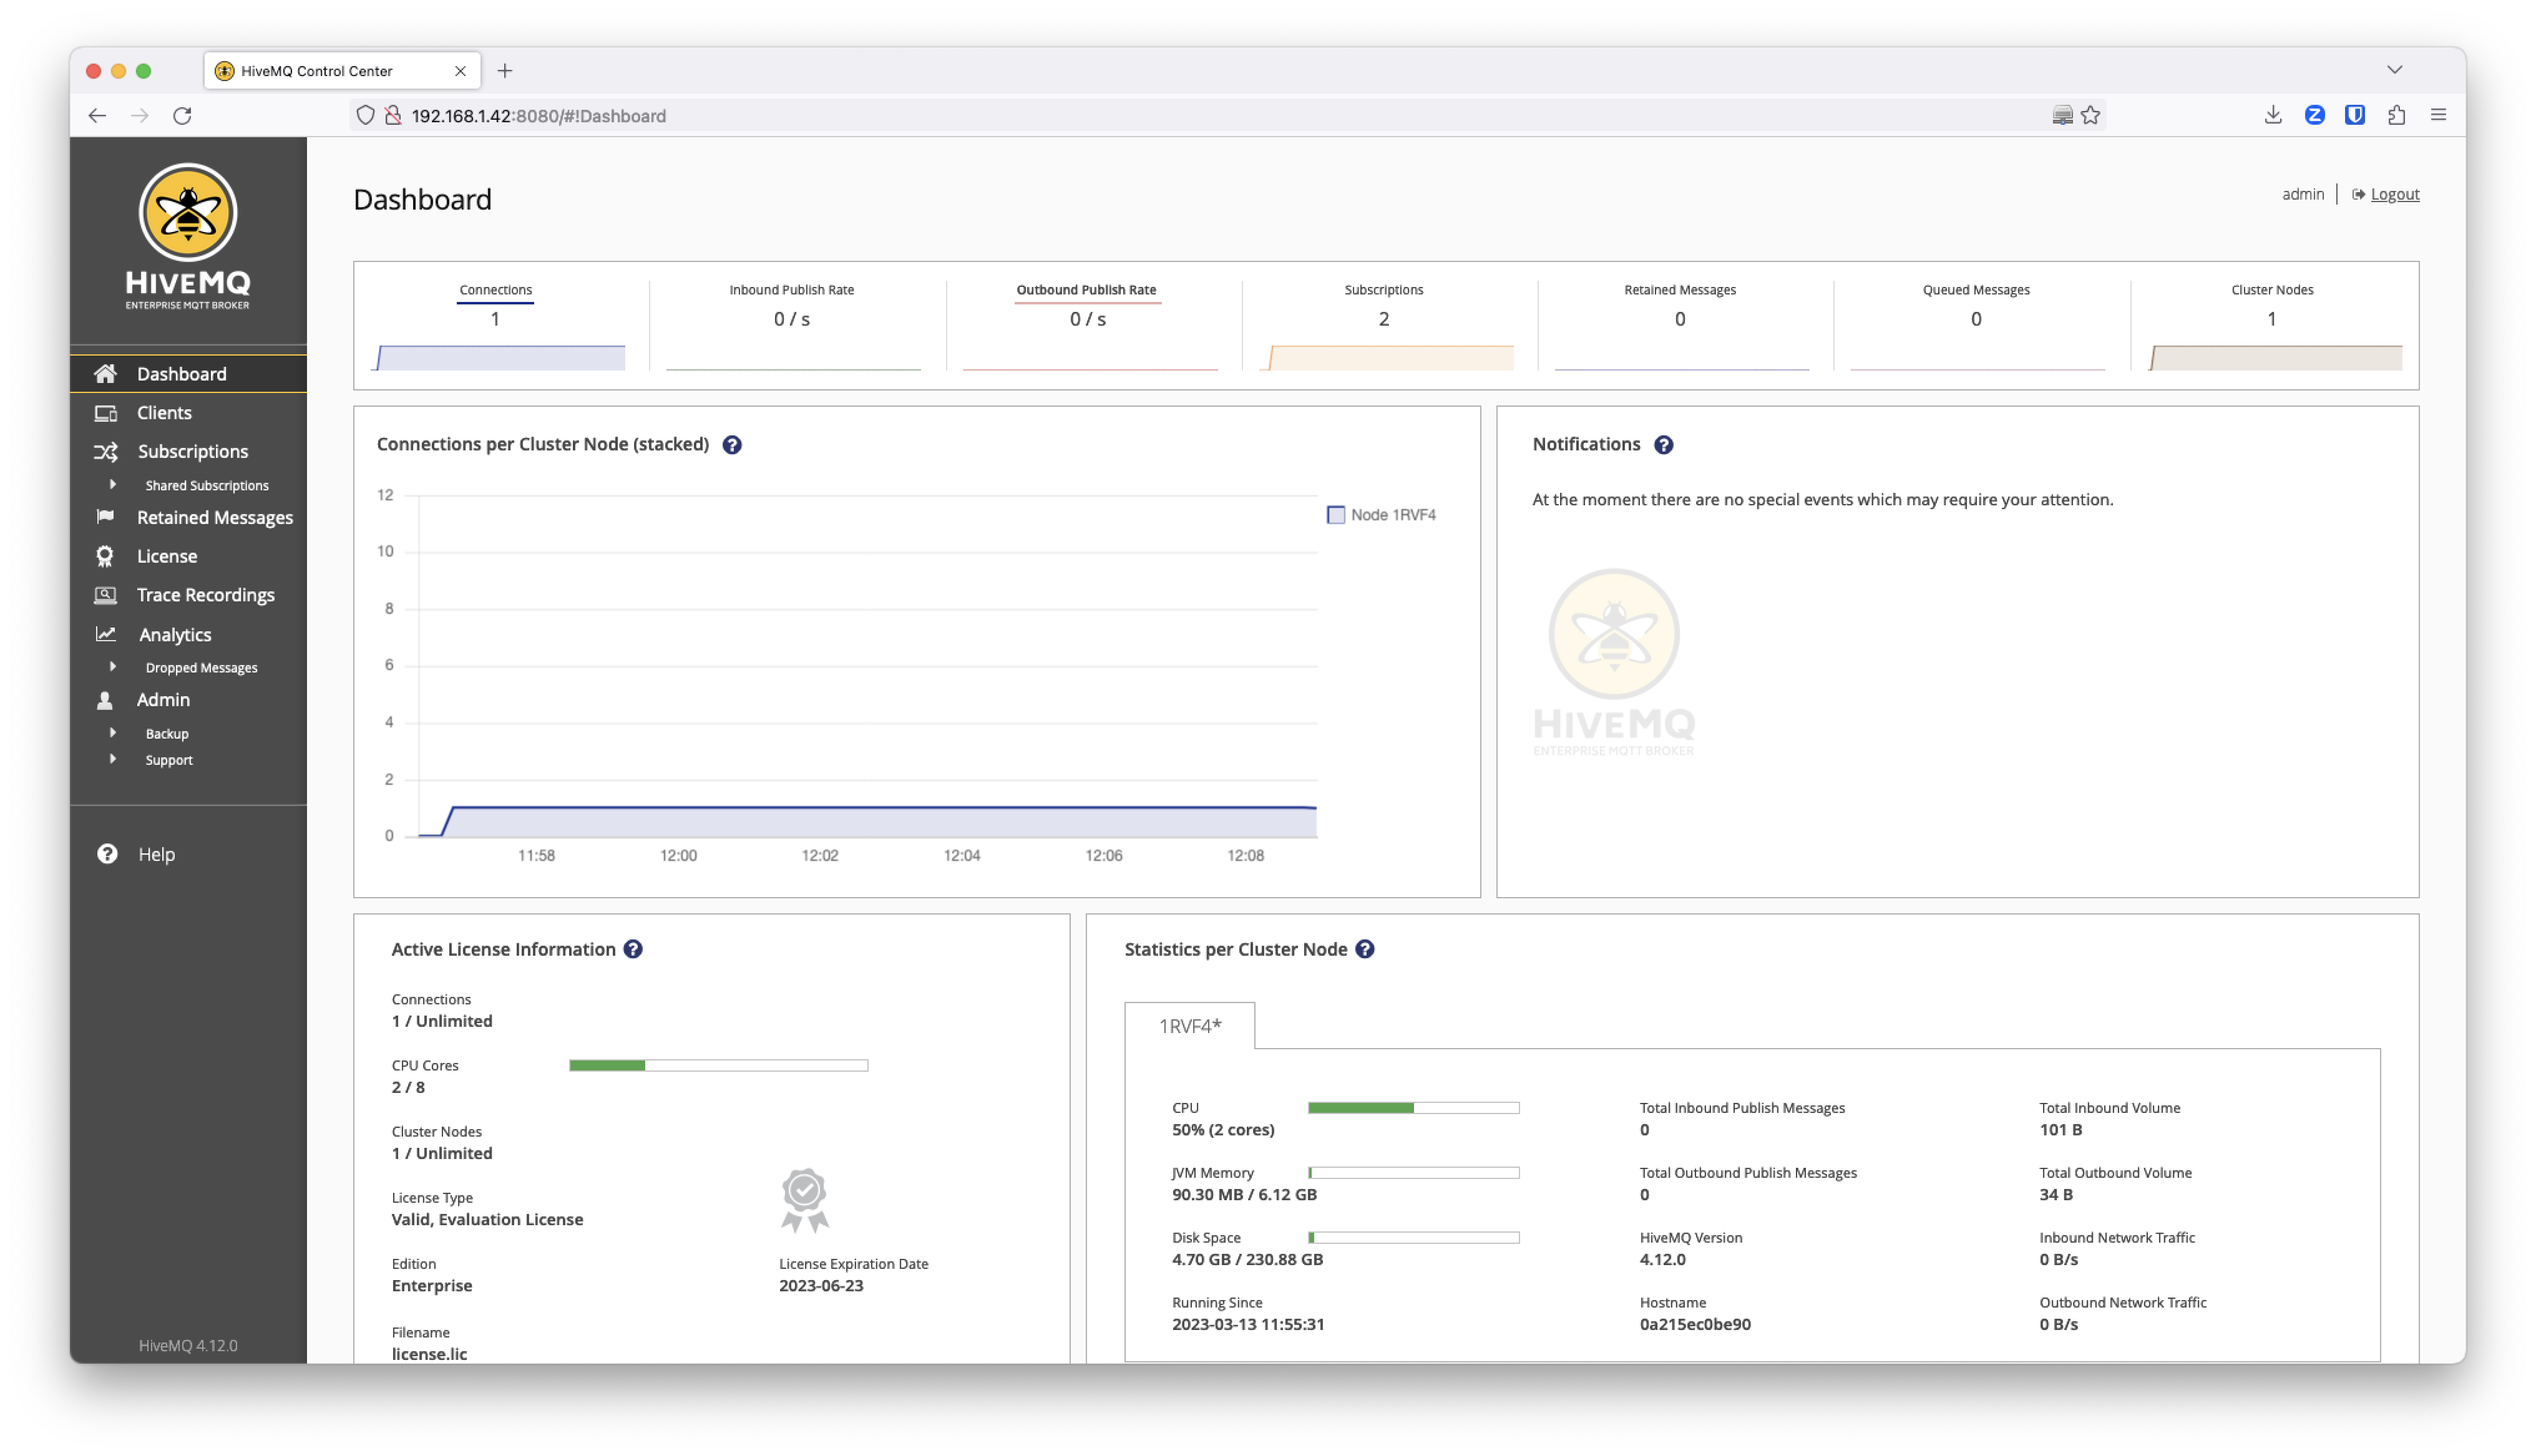
HiveMQ Control Center
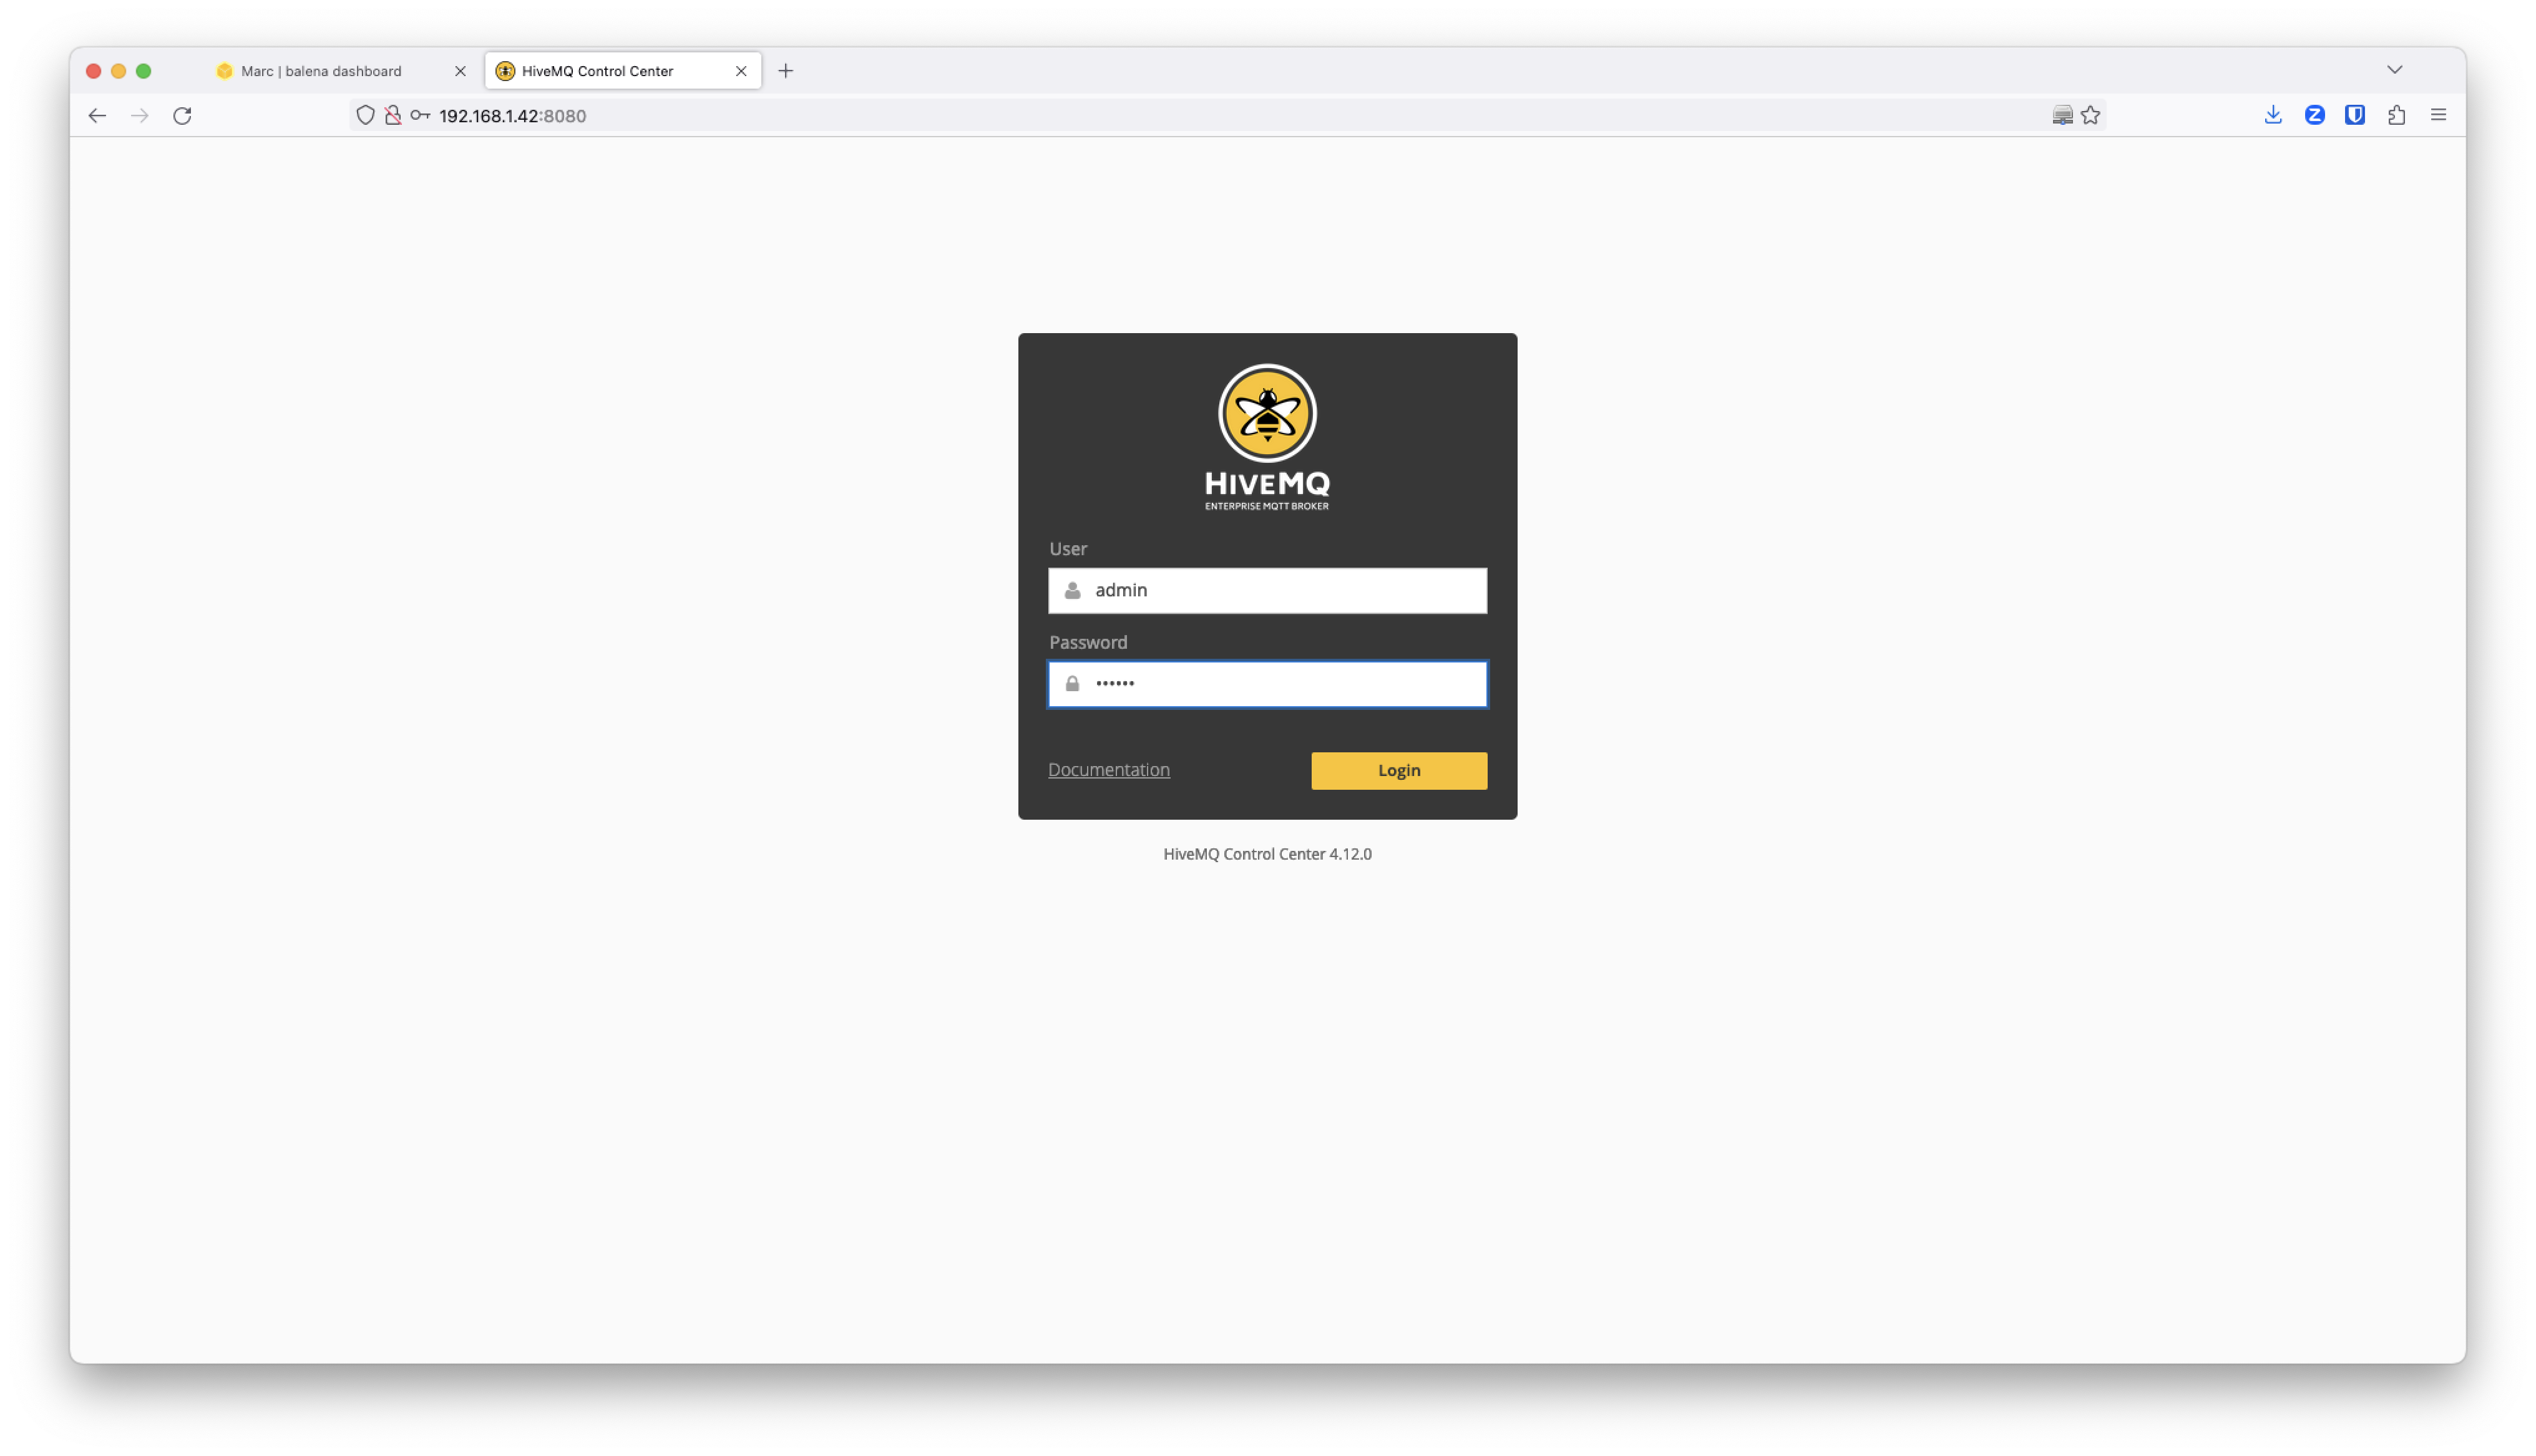
To check that HiveMQ is running properly, access the HiveMQ Control Center through the port 8080. Copy your local IP address or alternatively use the Public Device URL without https and the port 8080.
Use the credentials admin and hivemq as a password to access the HiveMQ Control Center.
With the Enterprise HiveMQ version running on the edge you can connect up to 25 devices or services to the HiveMQ MQTT broker for free. In case you would like to use the bridge extension (as we are going to do in the future here), HiveMQ will work for free for 5 hours, after which you will need to restart the HiveMQ service. Alternatively you can use the HiveMQ community edition.
Add you HiveMQ enterprise license
If you have an Enterprise HiveMQ license, you can add it to the balenaCloud Device Variables feature as explained below.
First, edit the license.lic file that you have received from HiveMQ via e-mail. To add it as a device variable it will need to be a single line of text, so replace new lines with the | character.
“`
file received by e-mail
Line 1
Line 2
single line text to paste as a device variable
line1|line2
“`
Once you have edited the license text, copy and paste it into the HIVEMQ_LICENSE device variable value field.
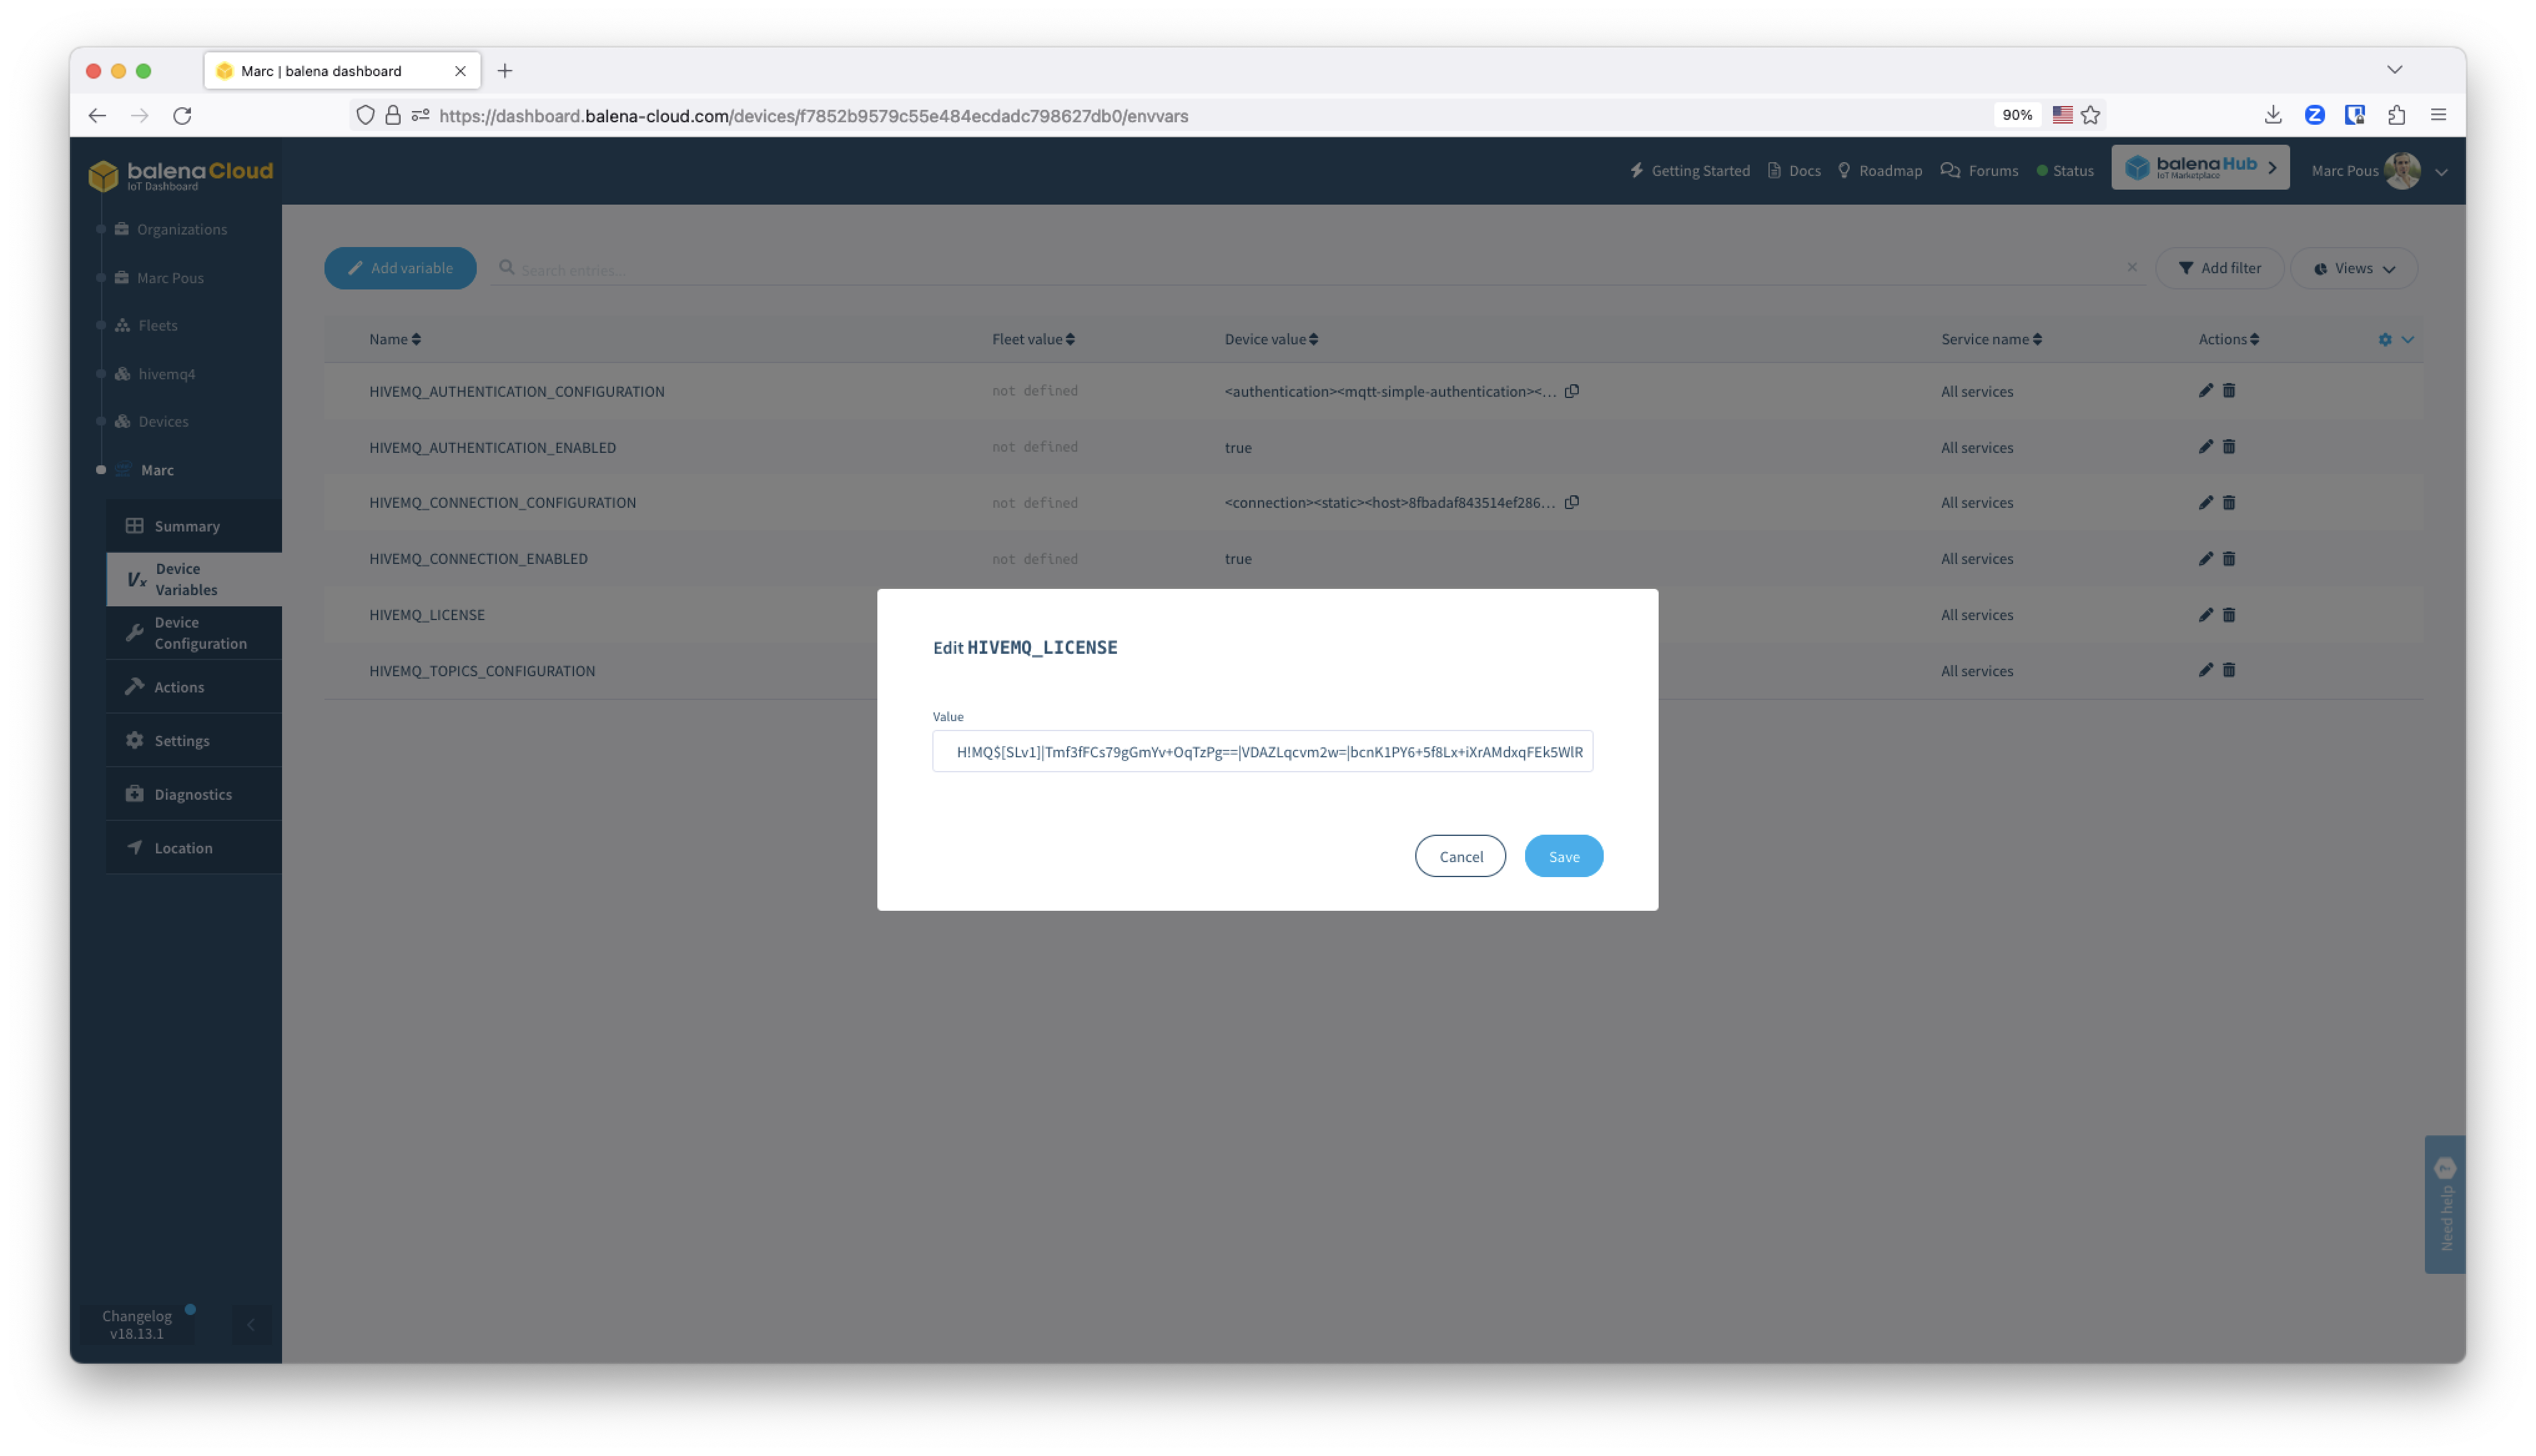
This will restart all the services from the device and it will automatically generate the license file on the gateway filesystem without the need to add any file.
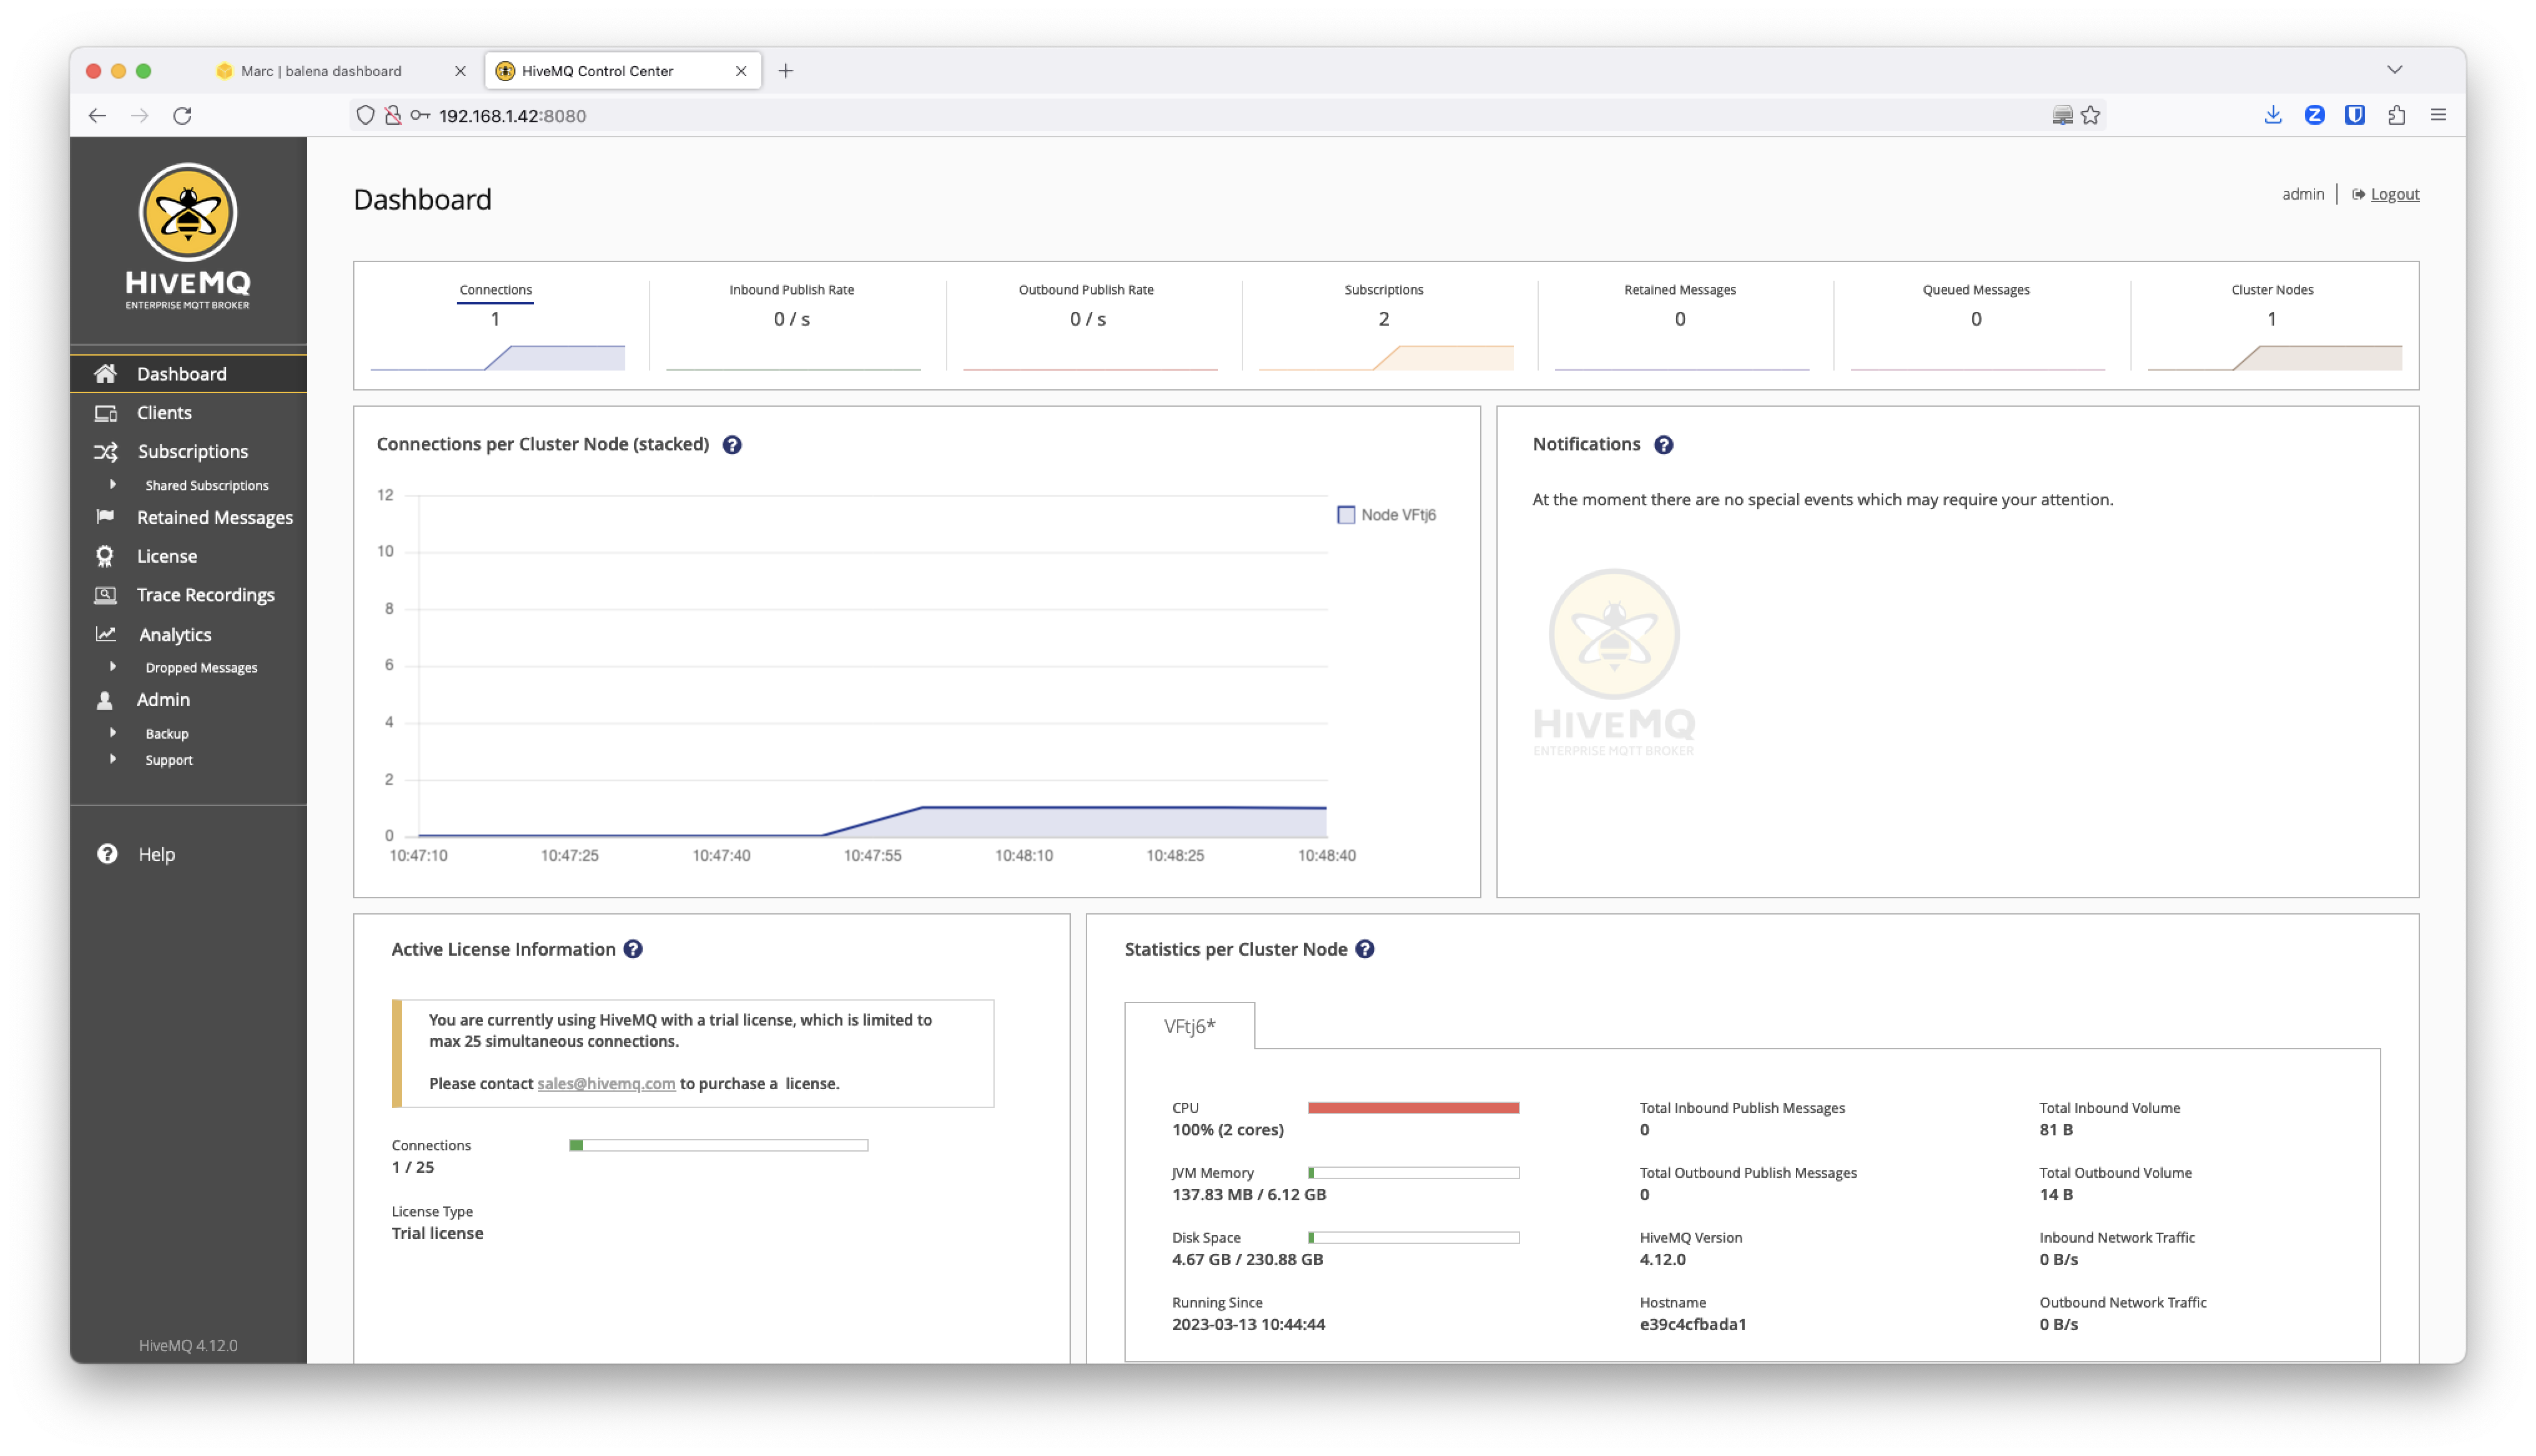
If you browse again to the HiveMQ Control Panel you will see the Active License Information enabled as in this example below.
NodeRED
The NodeRED service is located at port 80 of the device. Just use your local IP address or the Public Device URL of the device using the port 80.
To use the following flows and nodes on NodeRED we automatically deployed all the necessary libraries such as the library for Modbus, OPC UA, InfluxDB and dashboard among others.
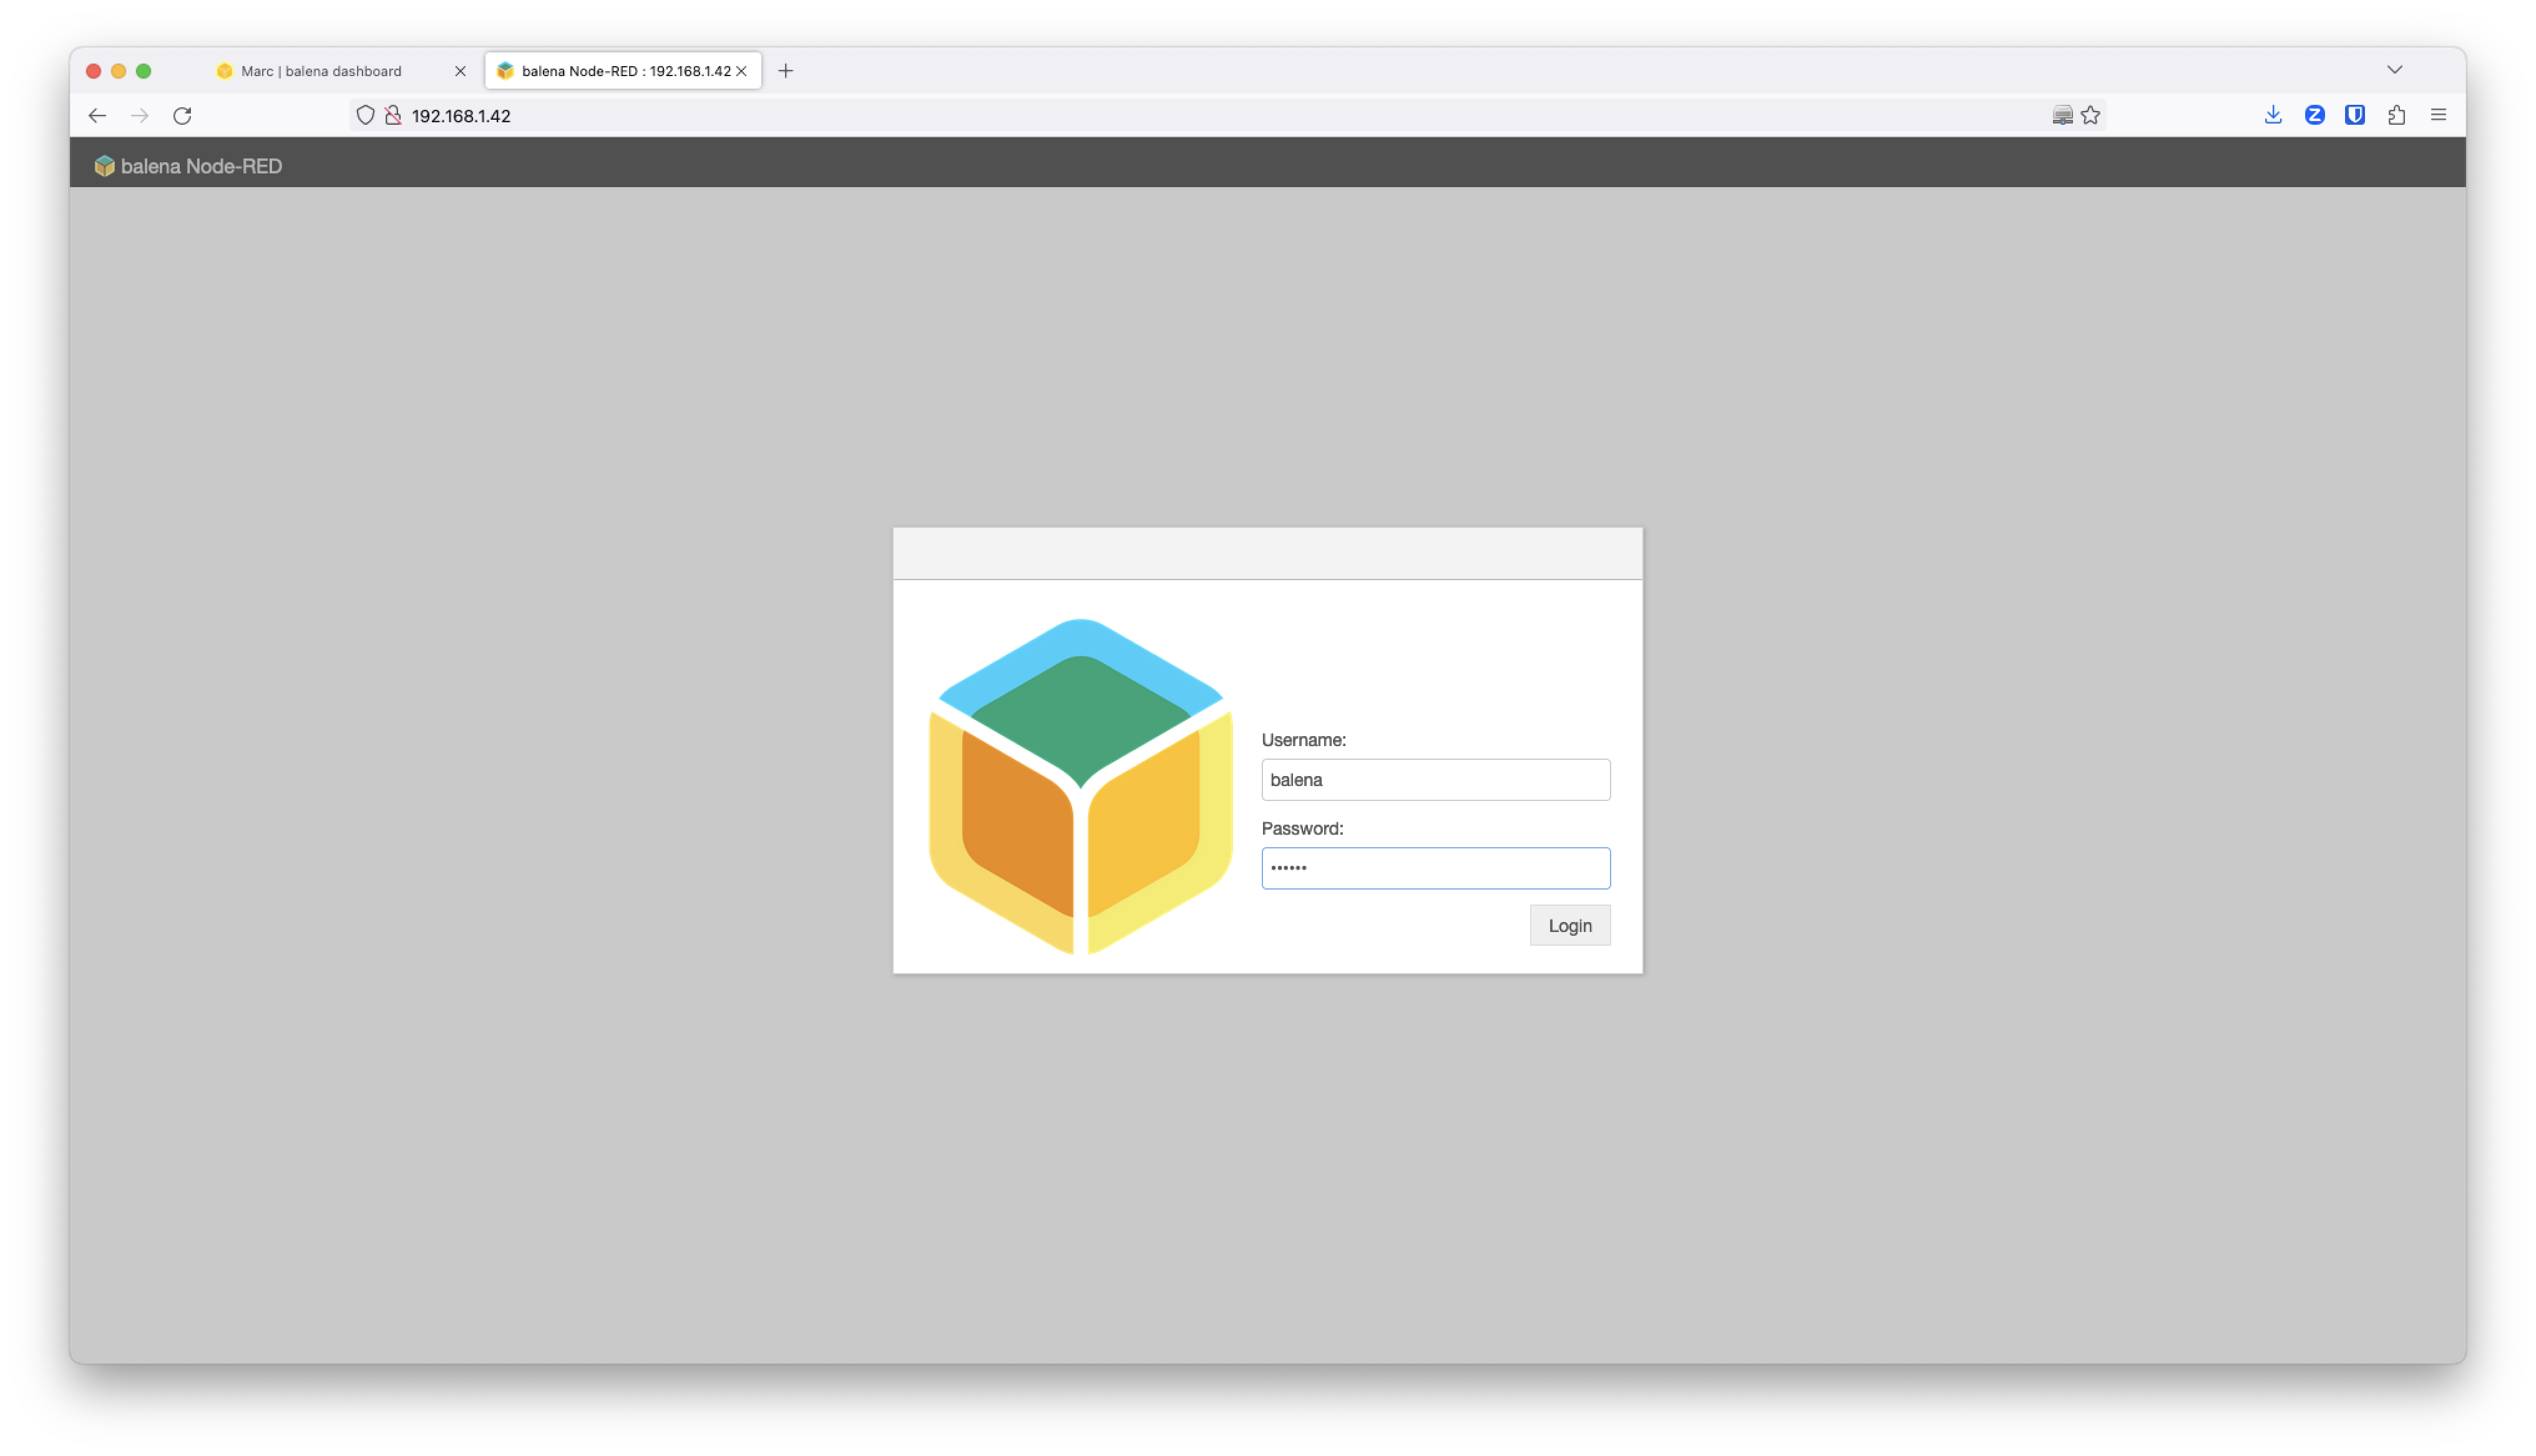
You can authenticate with the balena NodeRED service using the credentials balena and balena. You can change them using Device Variables via the variables USERNAME and PASSWORD for the NodeRED service.
You can find the hivemq.json flow here that we defined for access to the Modbus and OPC UA data from the PLCs.
As explained above, we are going to let NodeRED take care of polling from Modbus, processing the data, converting it into an ISA95 data model and publishing it to the MQTT broker using HiveMQ. That means that any service subscribed to the MQTT broker on the IT and OT realm of the factory can now access in real-time the Modbus data.
On the other hand, the OPC Client will send data, and we will convert it using the same ISA95 data model and publish it to the MQTT broker.

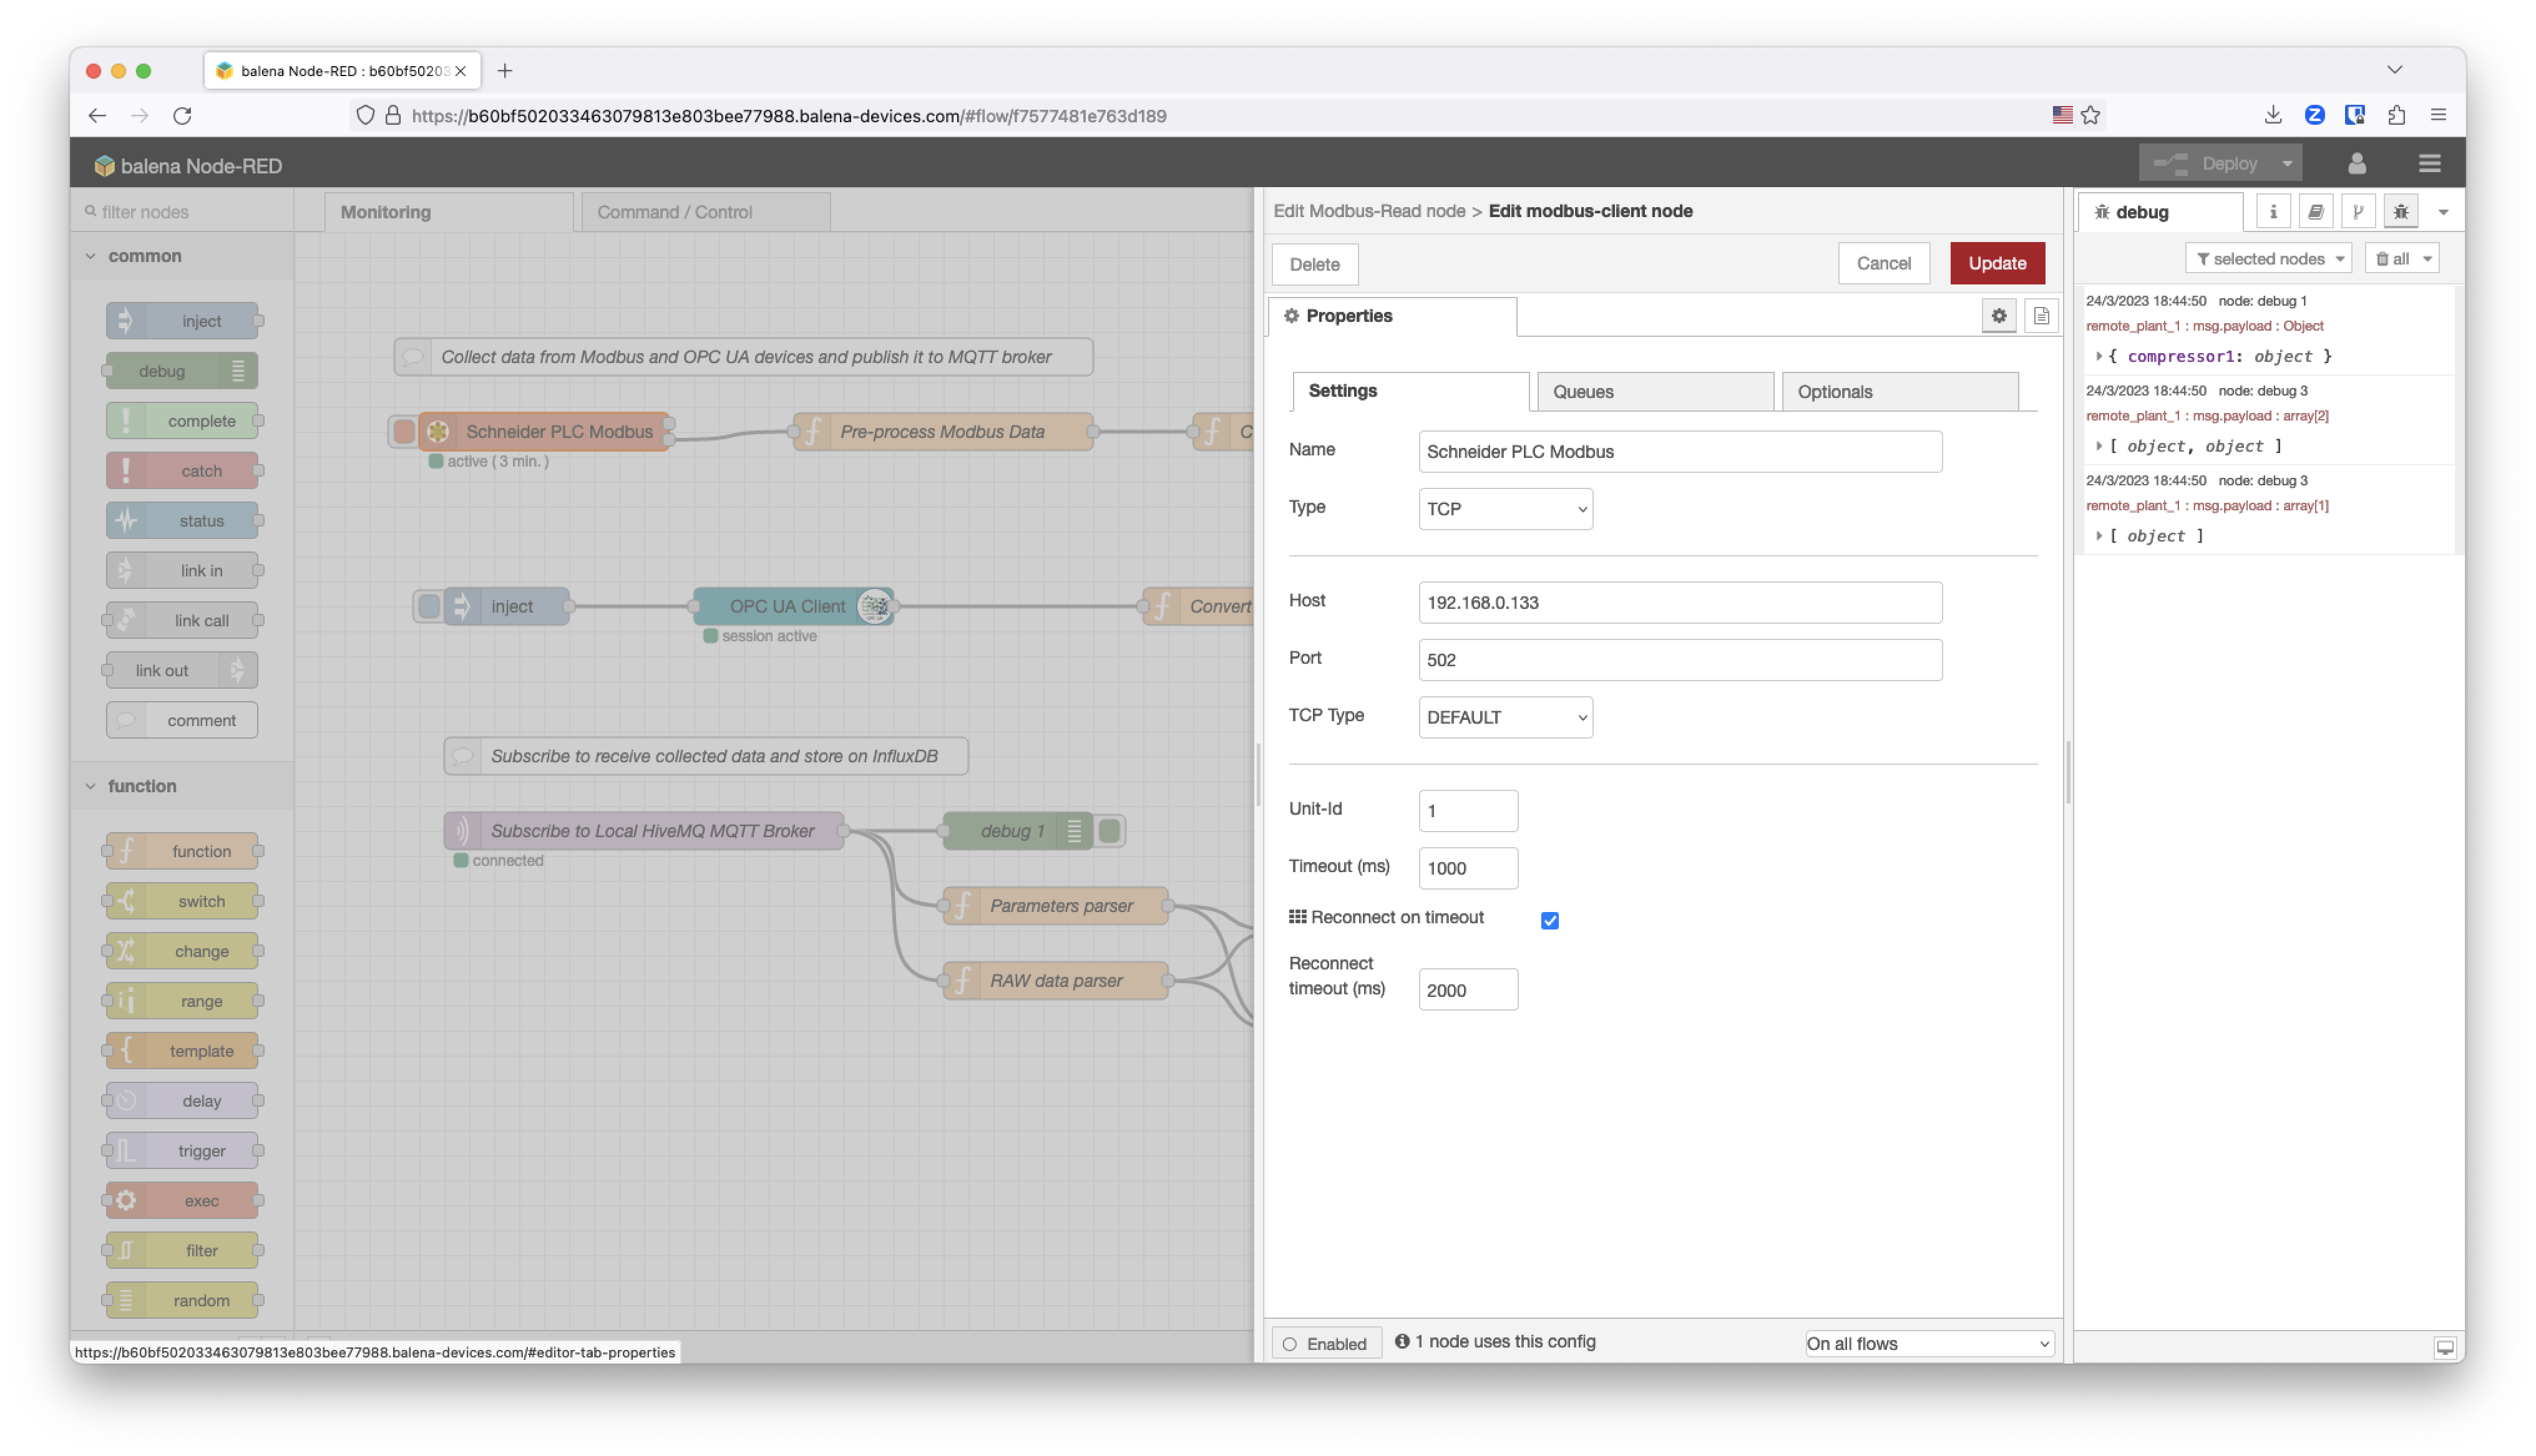
Modbus configuration
Let’s get deeper into the Schneider PLC Modbus node configuration. The Address where the temperature data is located is defined on the documentation and it’s the address 0, and it’s just 1 byte. During the development process we just defined the Poll Rate to 3 minutes but on production the Poll Rate will be 3 seconds.
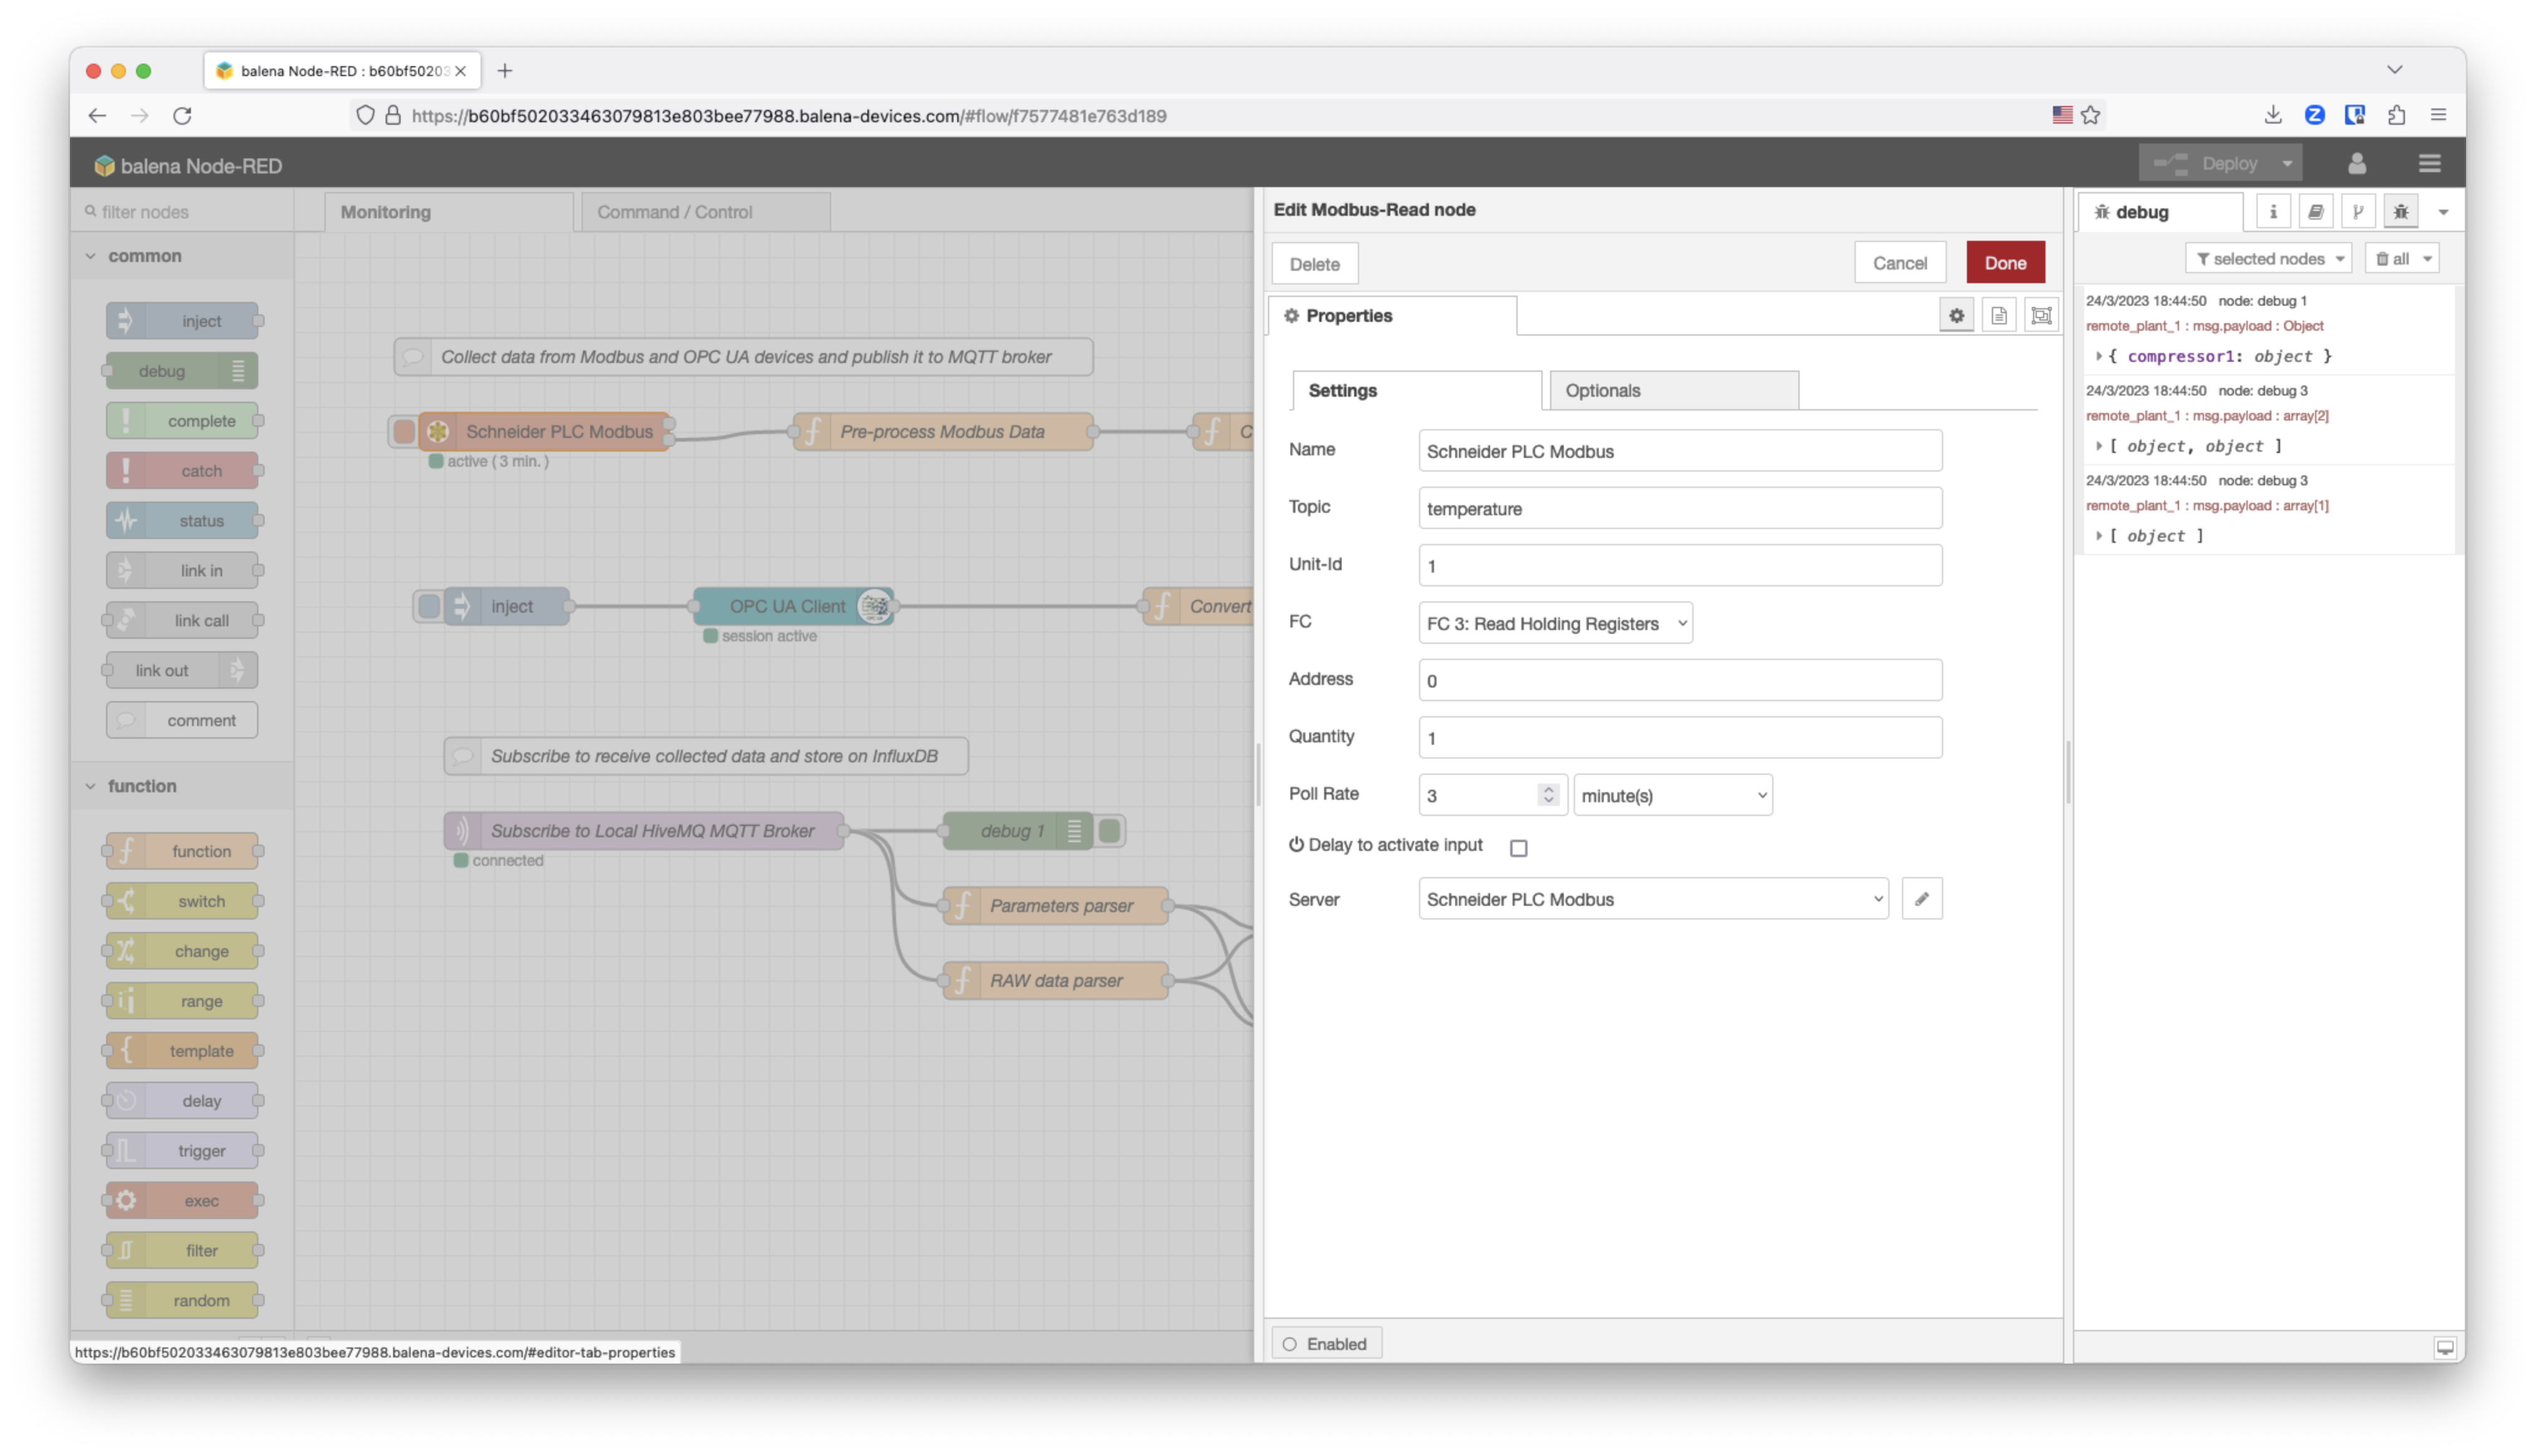
In this case we are using Modbus TCP, so this node is connected to the Modbus server. The Modbus device is accessible through the Host address on the OT network through TCP and the Port is the 502, as defined on the local network configuration.
The node Pre-process Modbus Data function transforms the data polled from the Modbus device.
newMsg.payload = { "temperature": (msg.payload.data[0]/100)*16, "id": "compressor1_temp" };
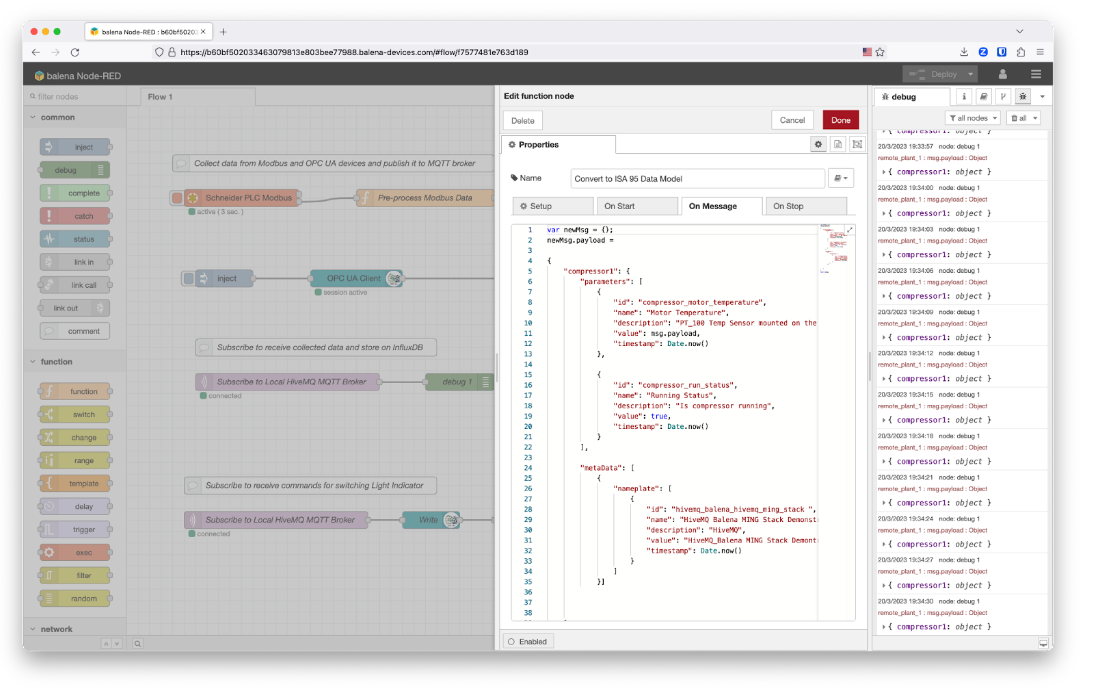
The ISA95 Data Model function converts the data into a specific data model that will standardize the data coming from Modbus or OPC UA devices. The Modbus device data is going to be under the compressor1 object. There are two types of data: temperature and run status.
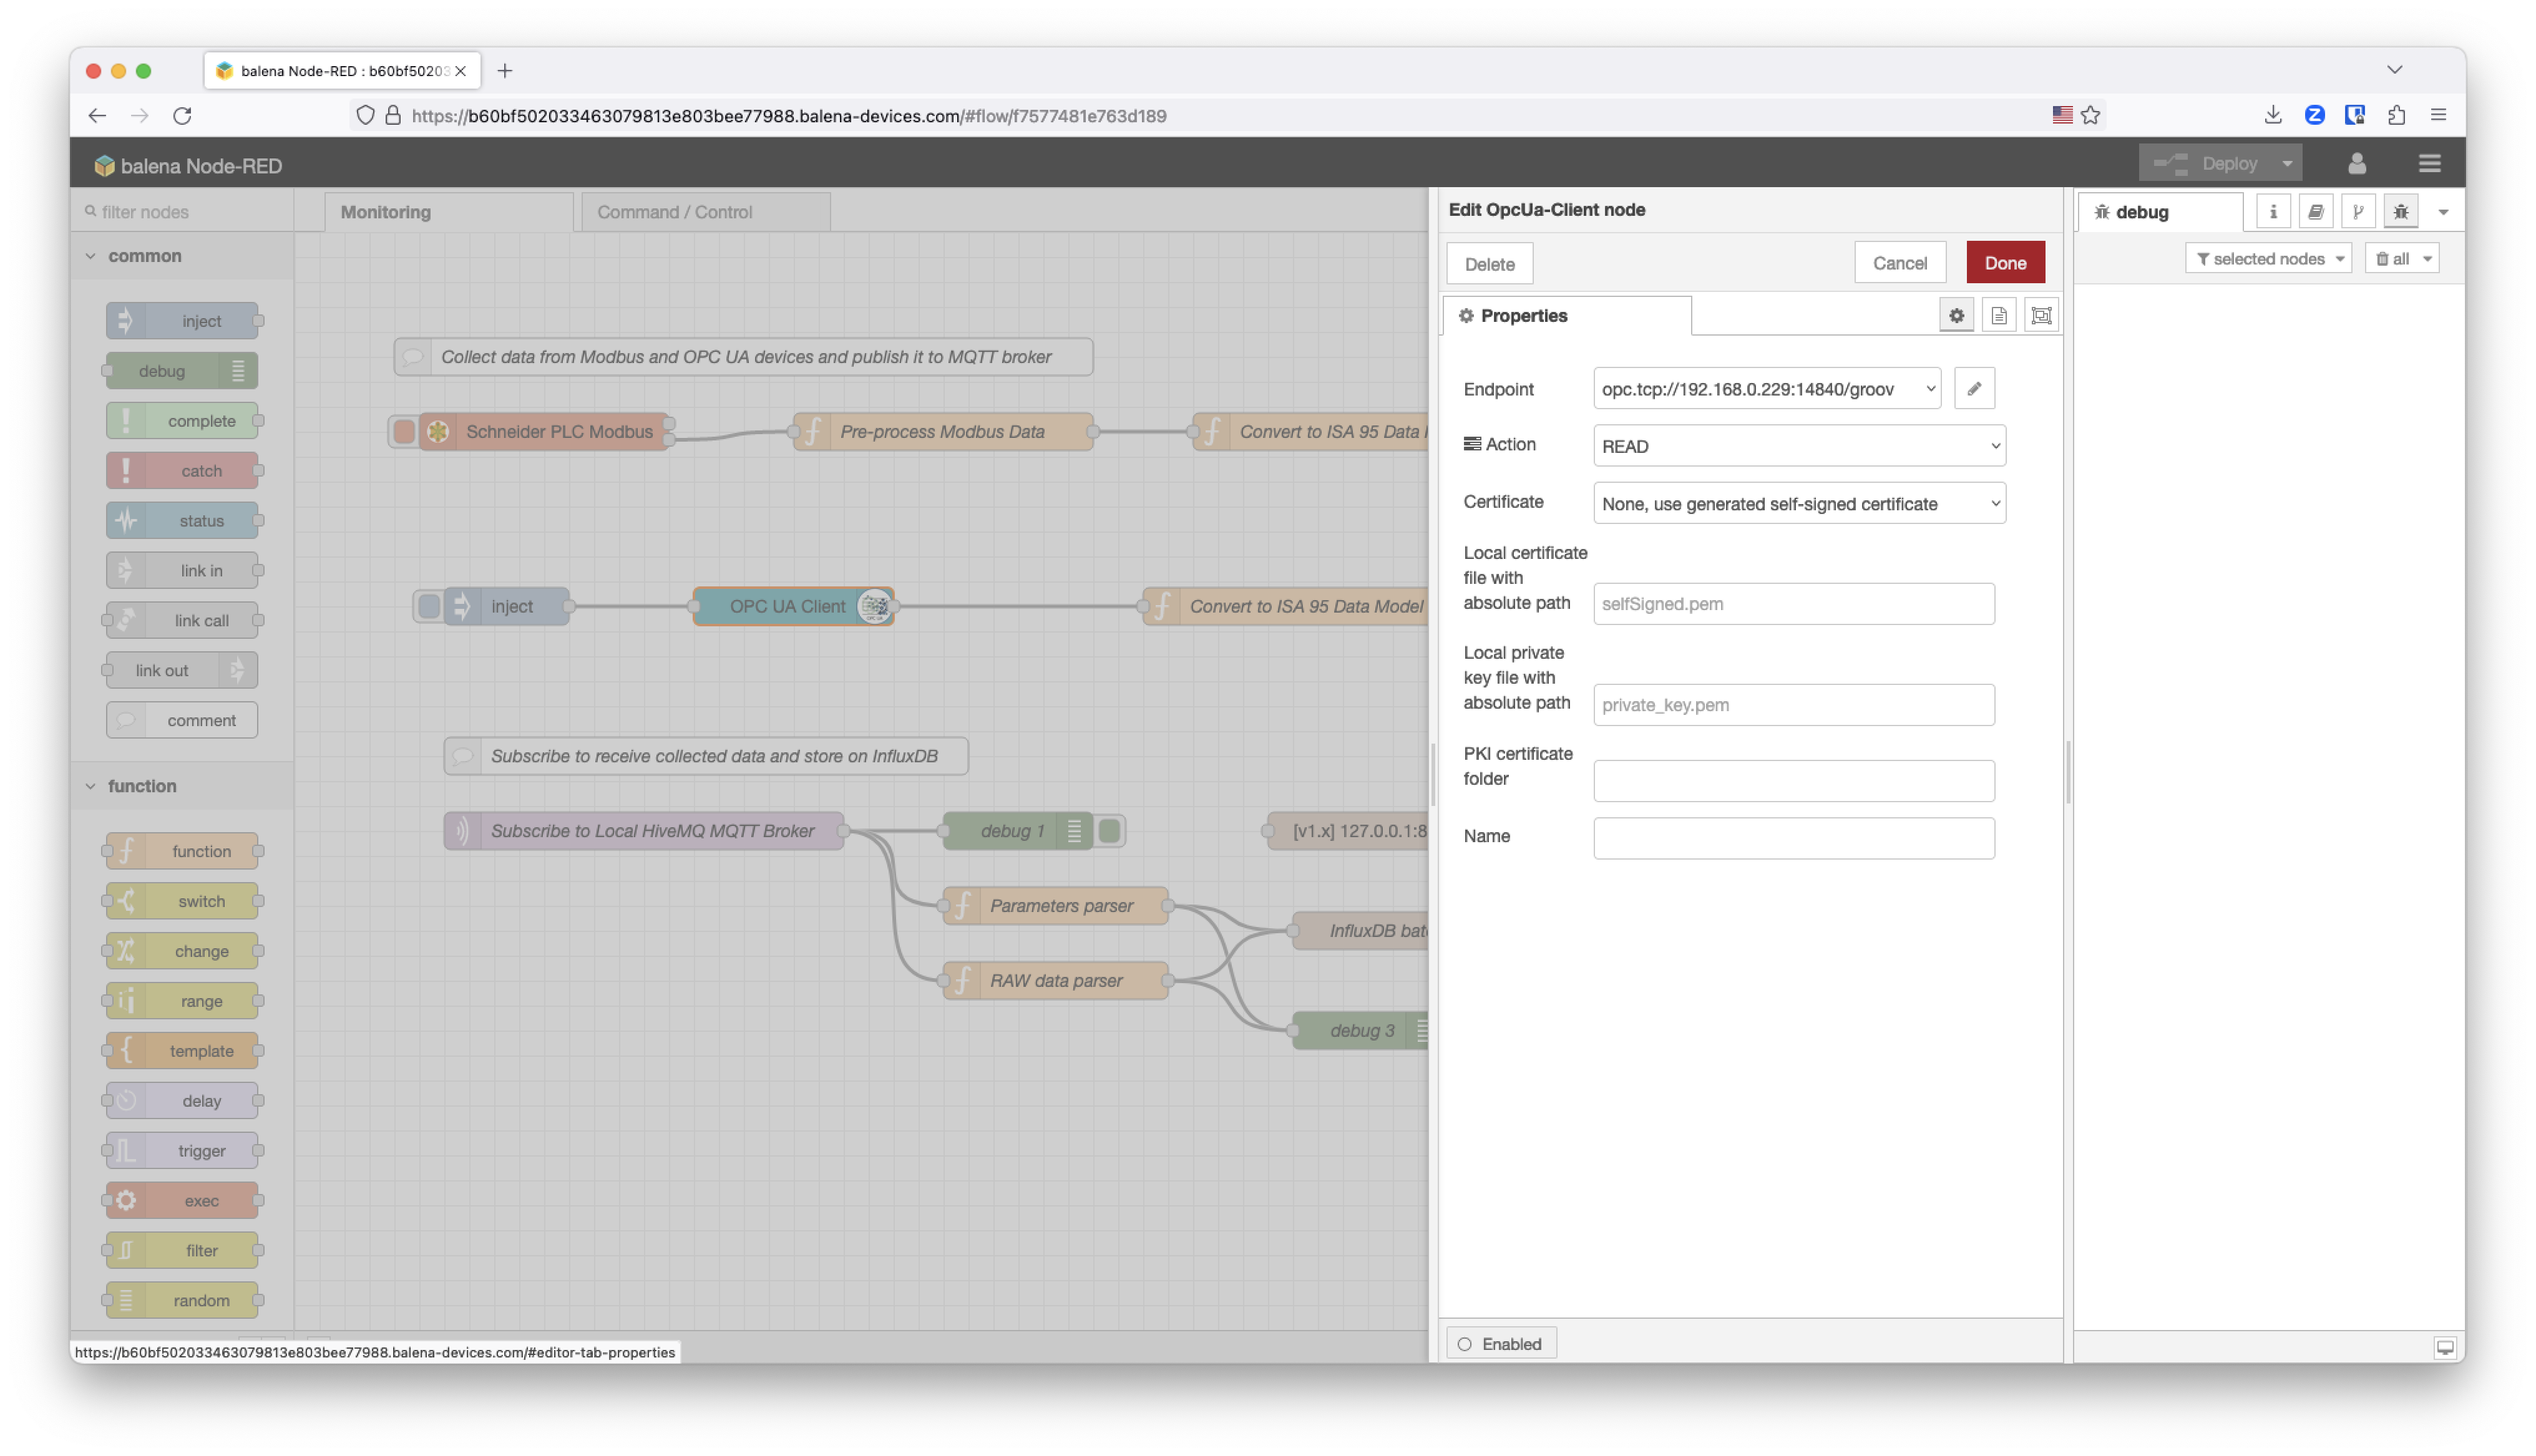
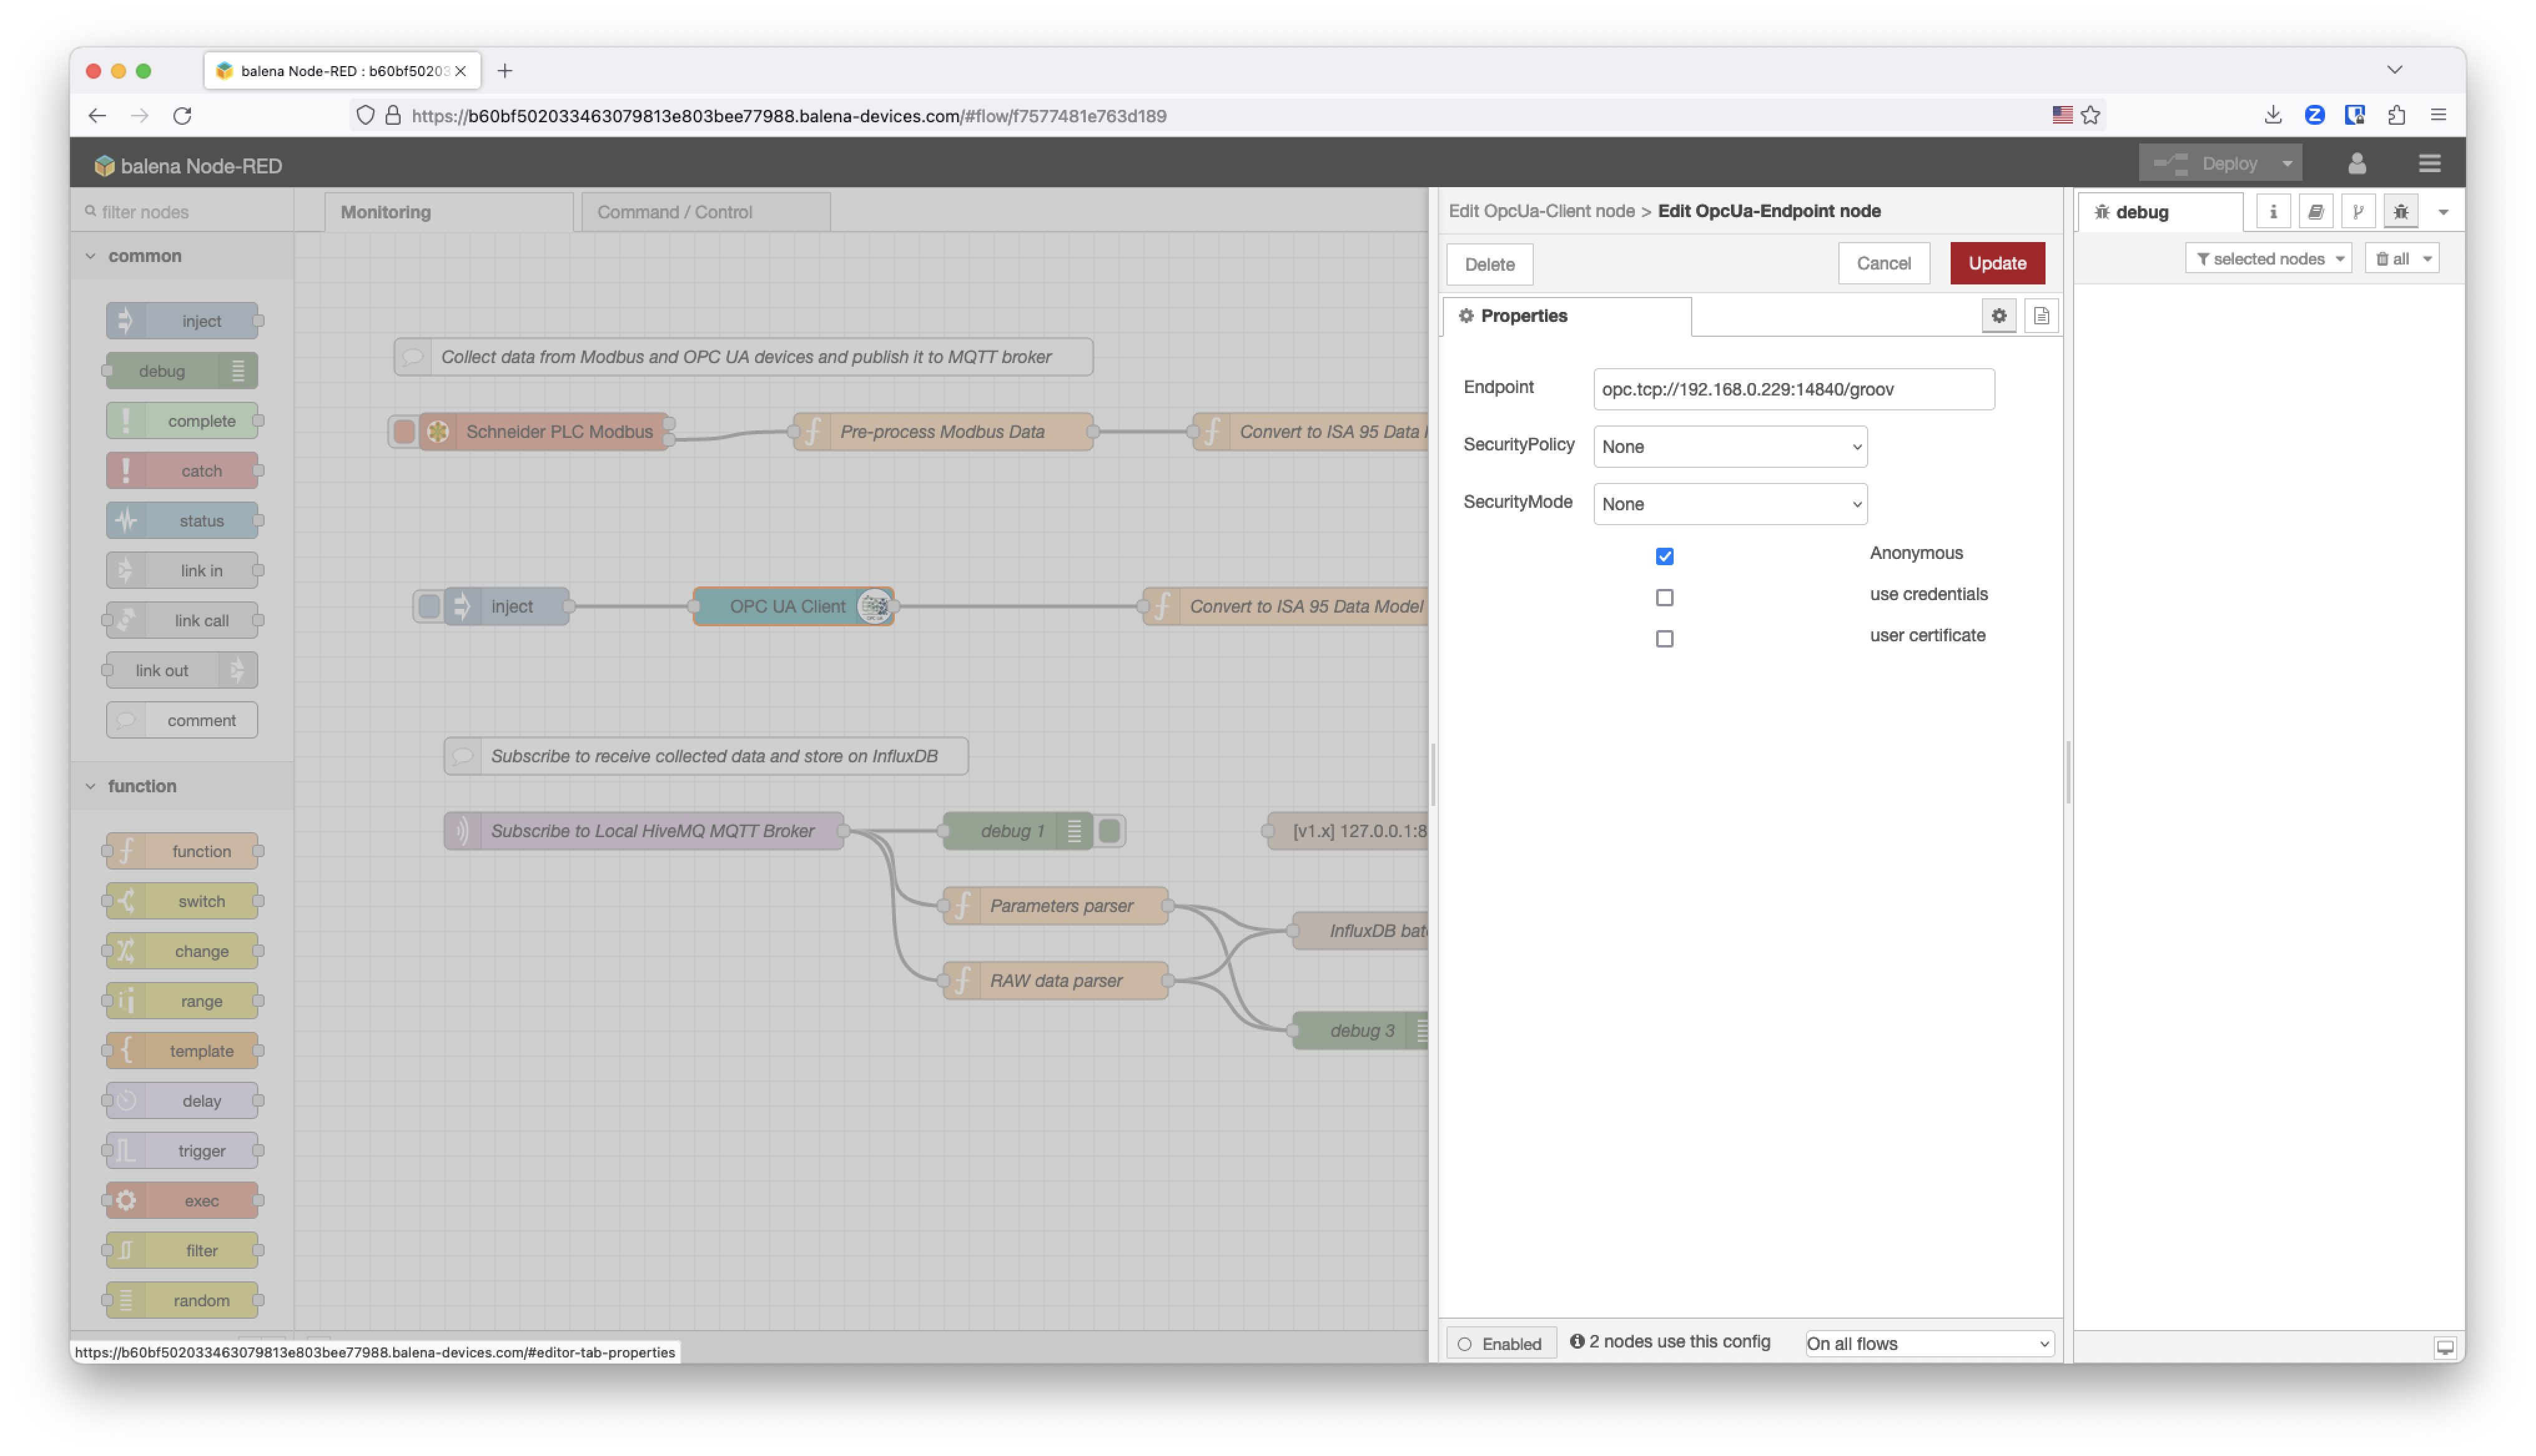
OPC UA configuration
The OPC UA Client node configuration for the compressor2 is reading from the OPC UA endpoint on the OT network. In this case we are using an Opto 22 PLC.
This is the function that models the data received using the ISA95 Data Model standard defined for the project. In this case, the data coming from this PLC will be managed under the compressor2 as happened with compressor1.
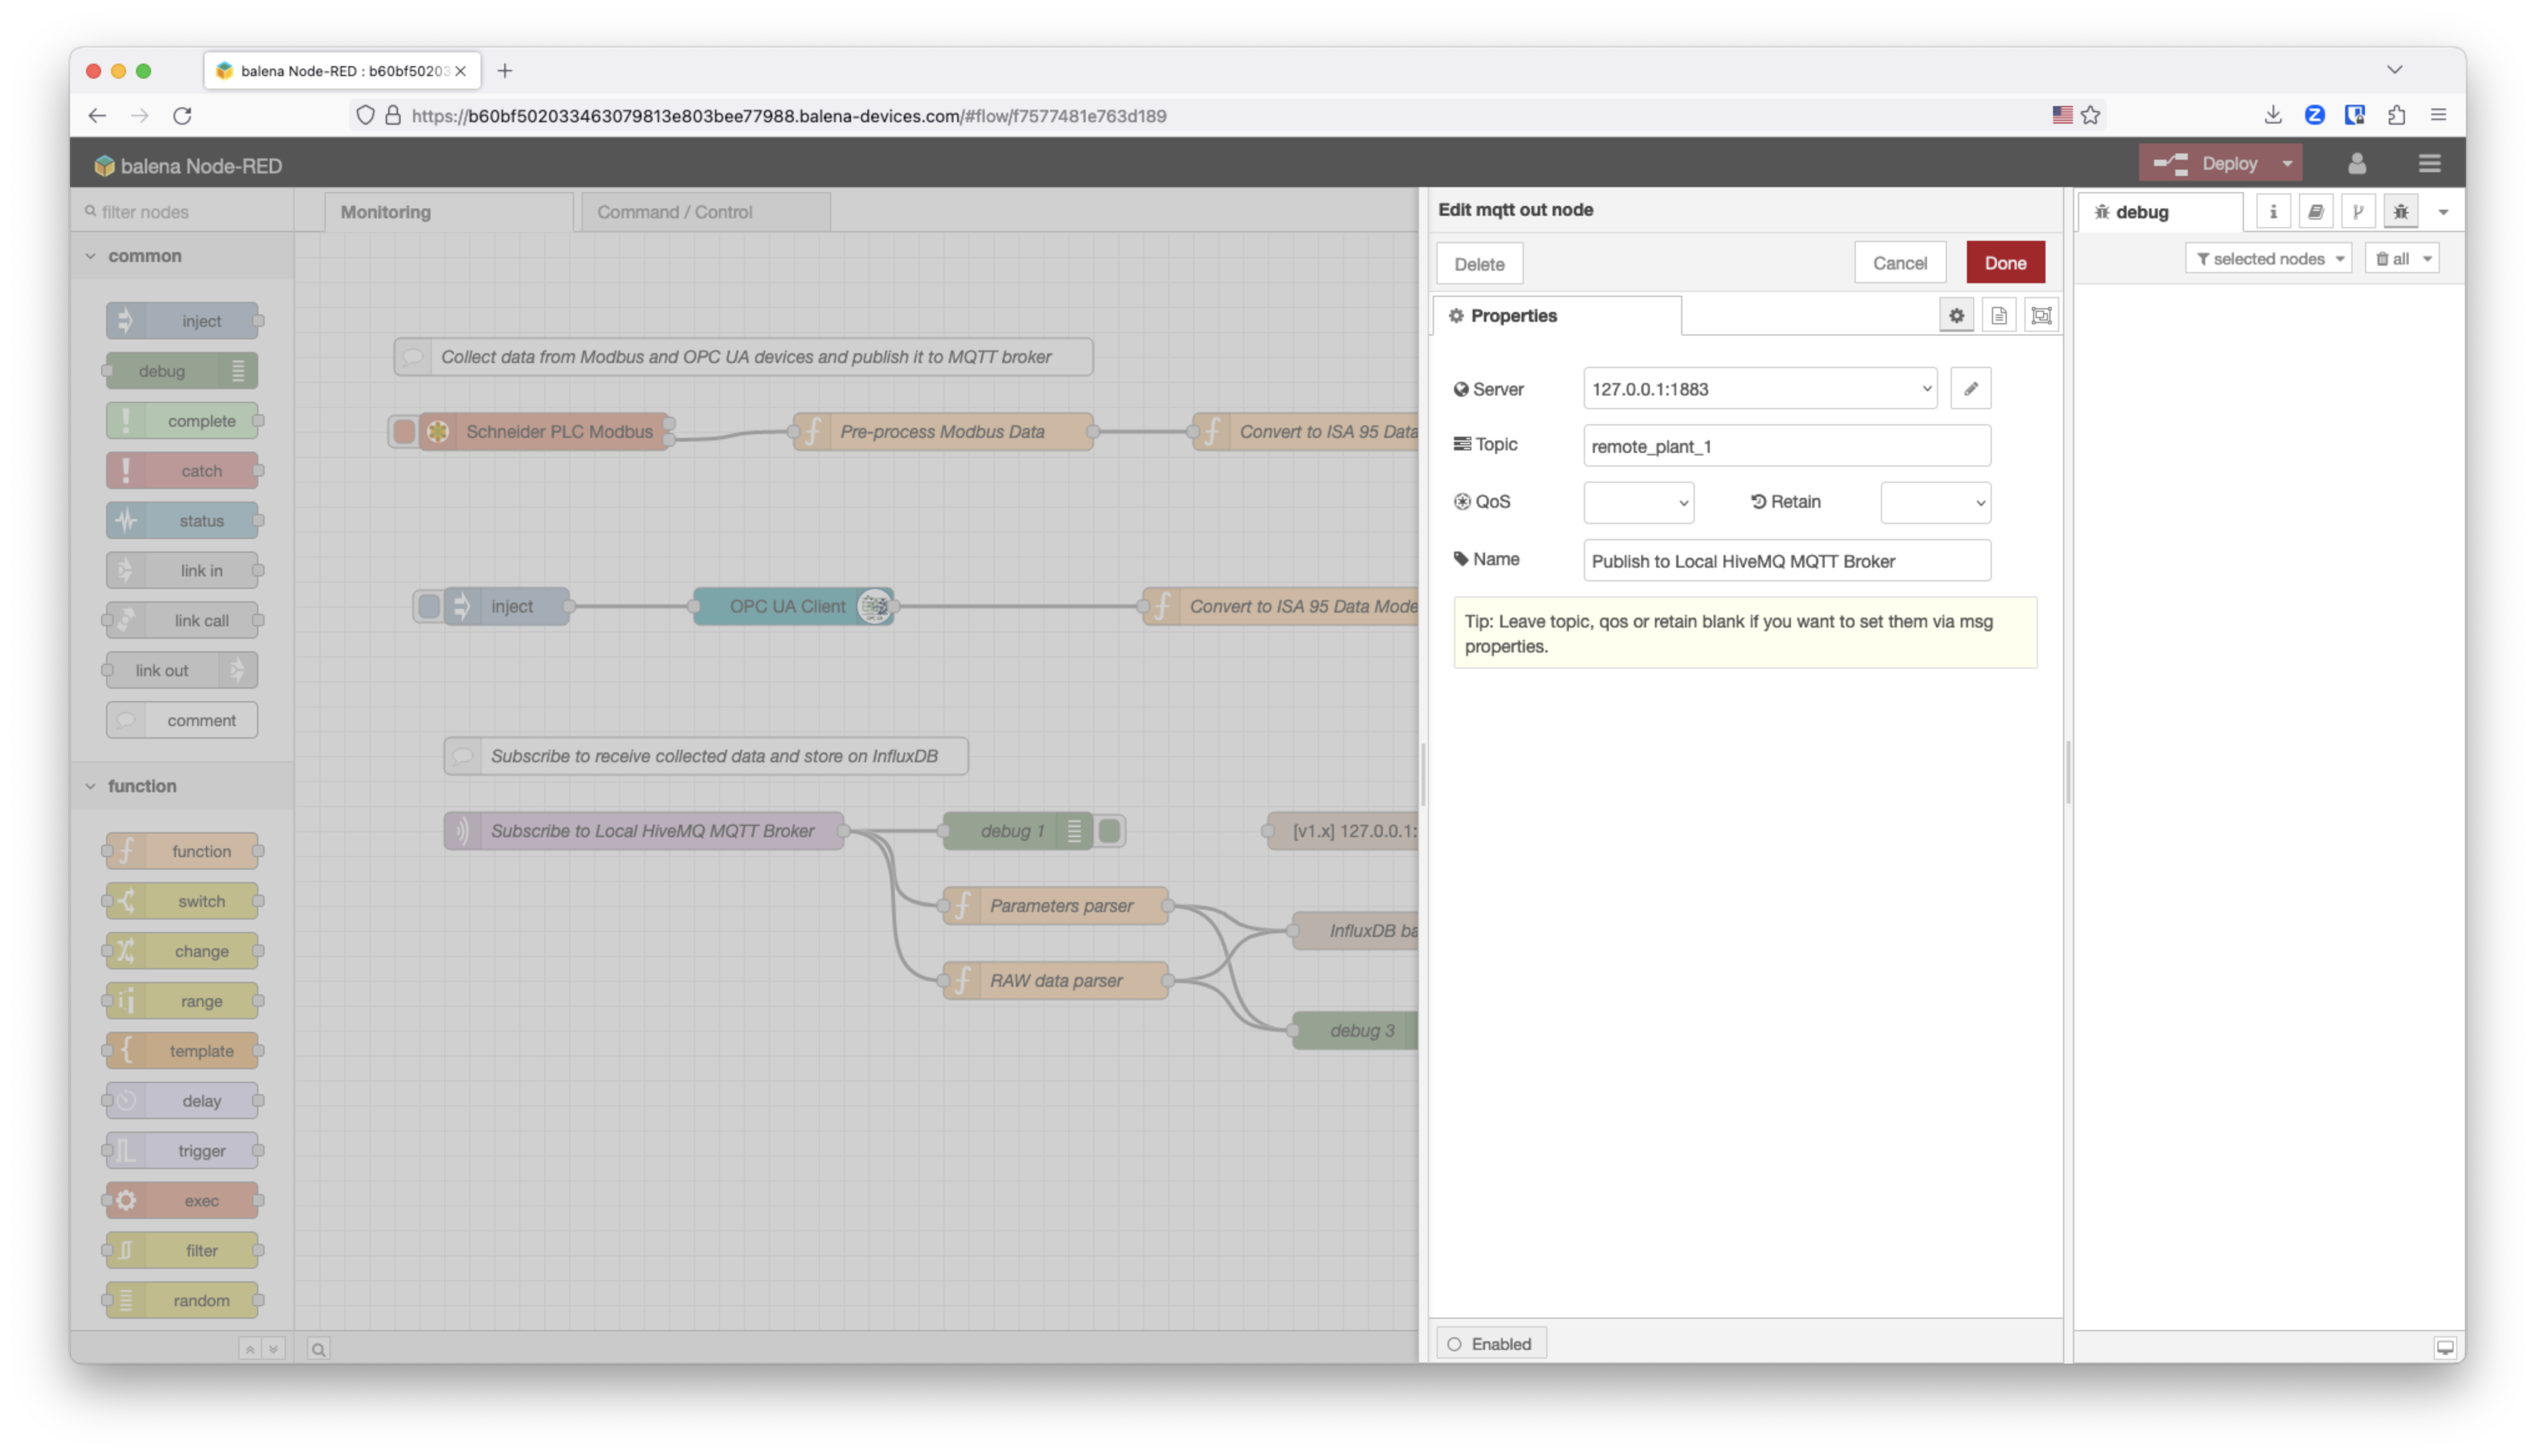
Configure the MQTT broker
The HiveMQ MQTT broker is exposed at the localhost on port 1883. The topic that we are going to use is remote_plant_1.
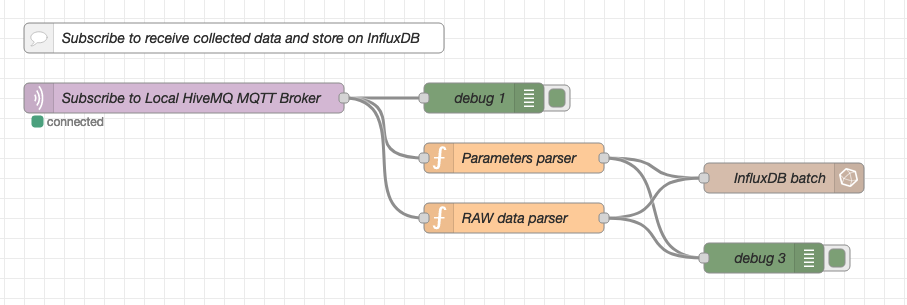
Store the data to InfluxDB
The data that will be stored to InfluxDB is collected via a MQTT subscription from the HiveMQ broker.
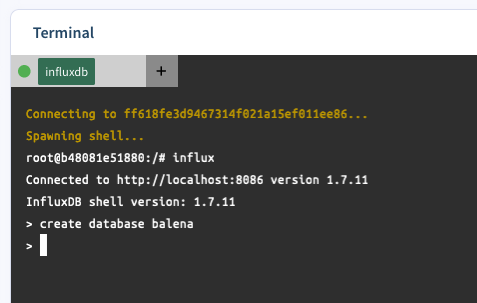
The database used is called balena. In case it doesn’t exist automatically, you will need to go to balenaCloud, and access through the Terminal to the InfluxDB service and get into the influx CLI and type create database balena. You can change balena for anything else here.
We decided to store the data in two different measurements:
- Store the
RAW datacoming on the ISA95 format associated with the timestamp, in case that any other service would like to query the data. - Store specific parts of the data modeled (e.g. temperature and run status) from the compressors using the InfluxDB JSON payload model. To store the data we are going to use the
InfluxDB batchnode instead of theoutnode. That means that the measurement will be defined on the JSON payload.
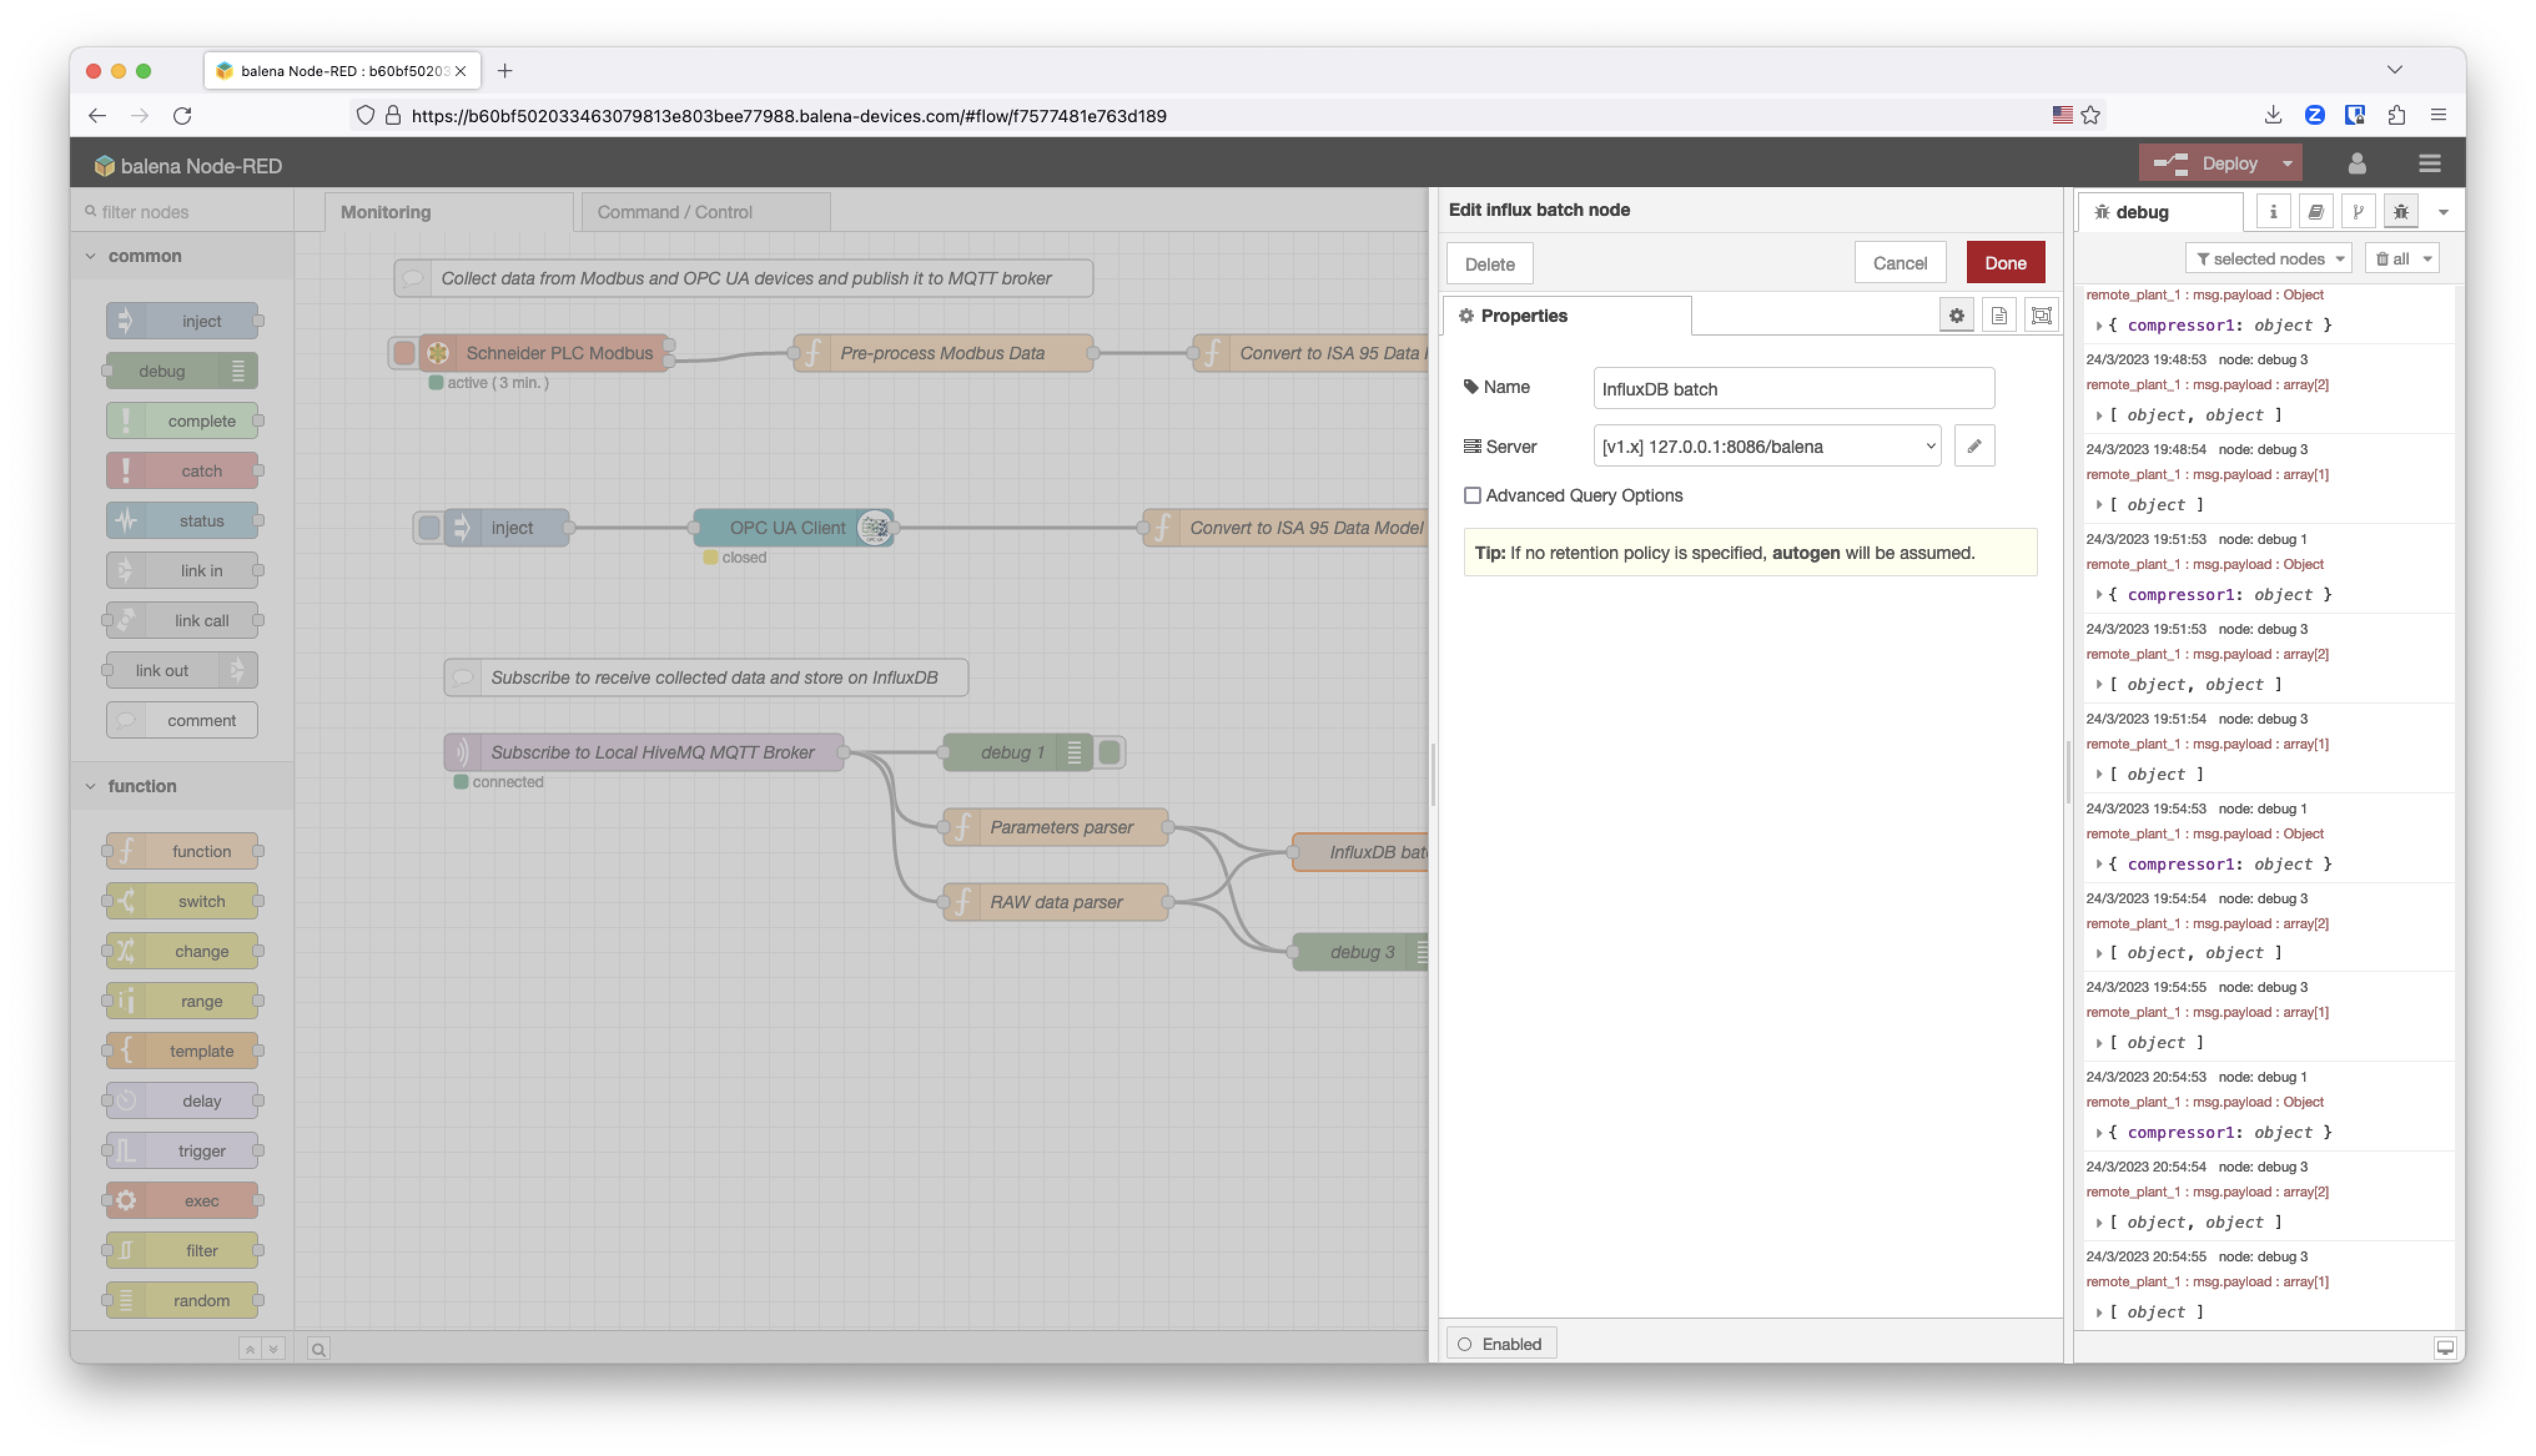
This is the configuration of the InfluxDB batch node. Take into account that we created a database on the InfluxDB container called balena.
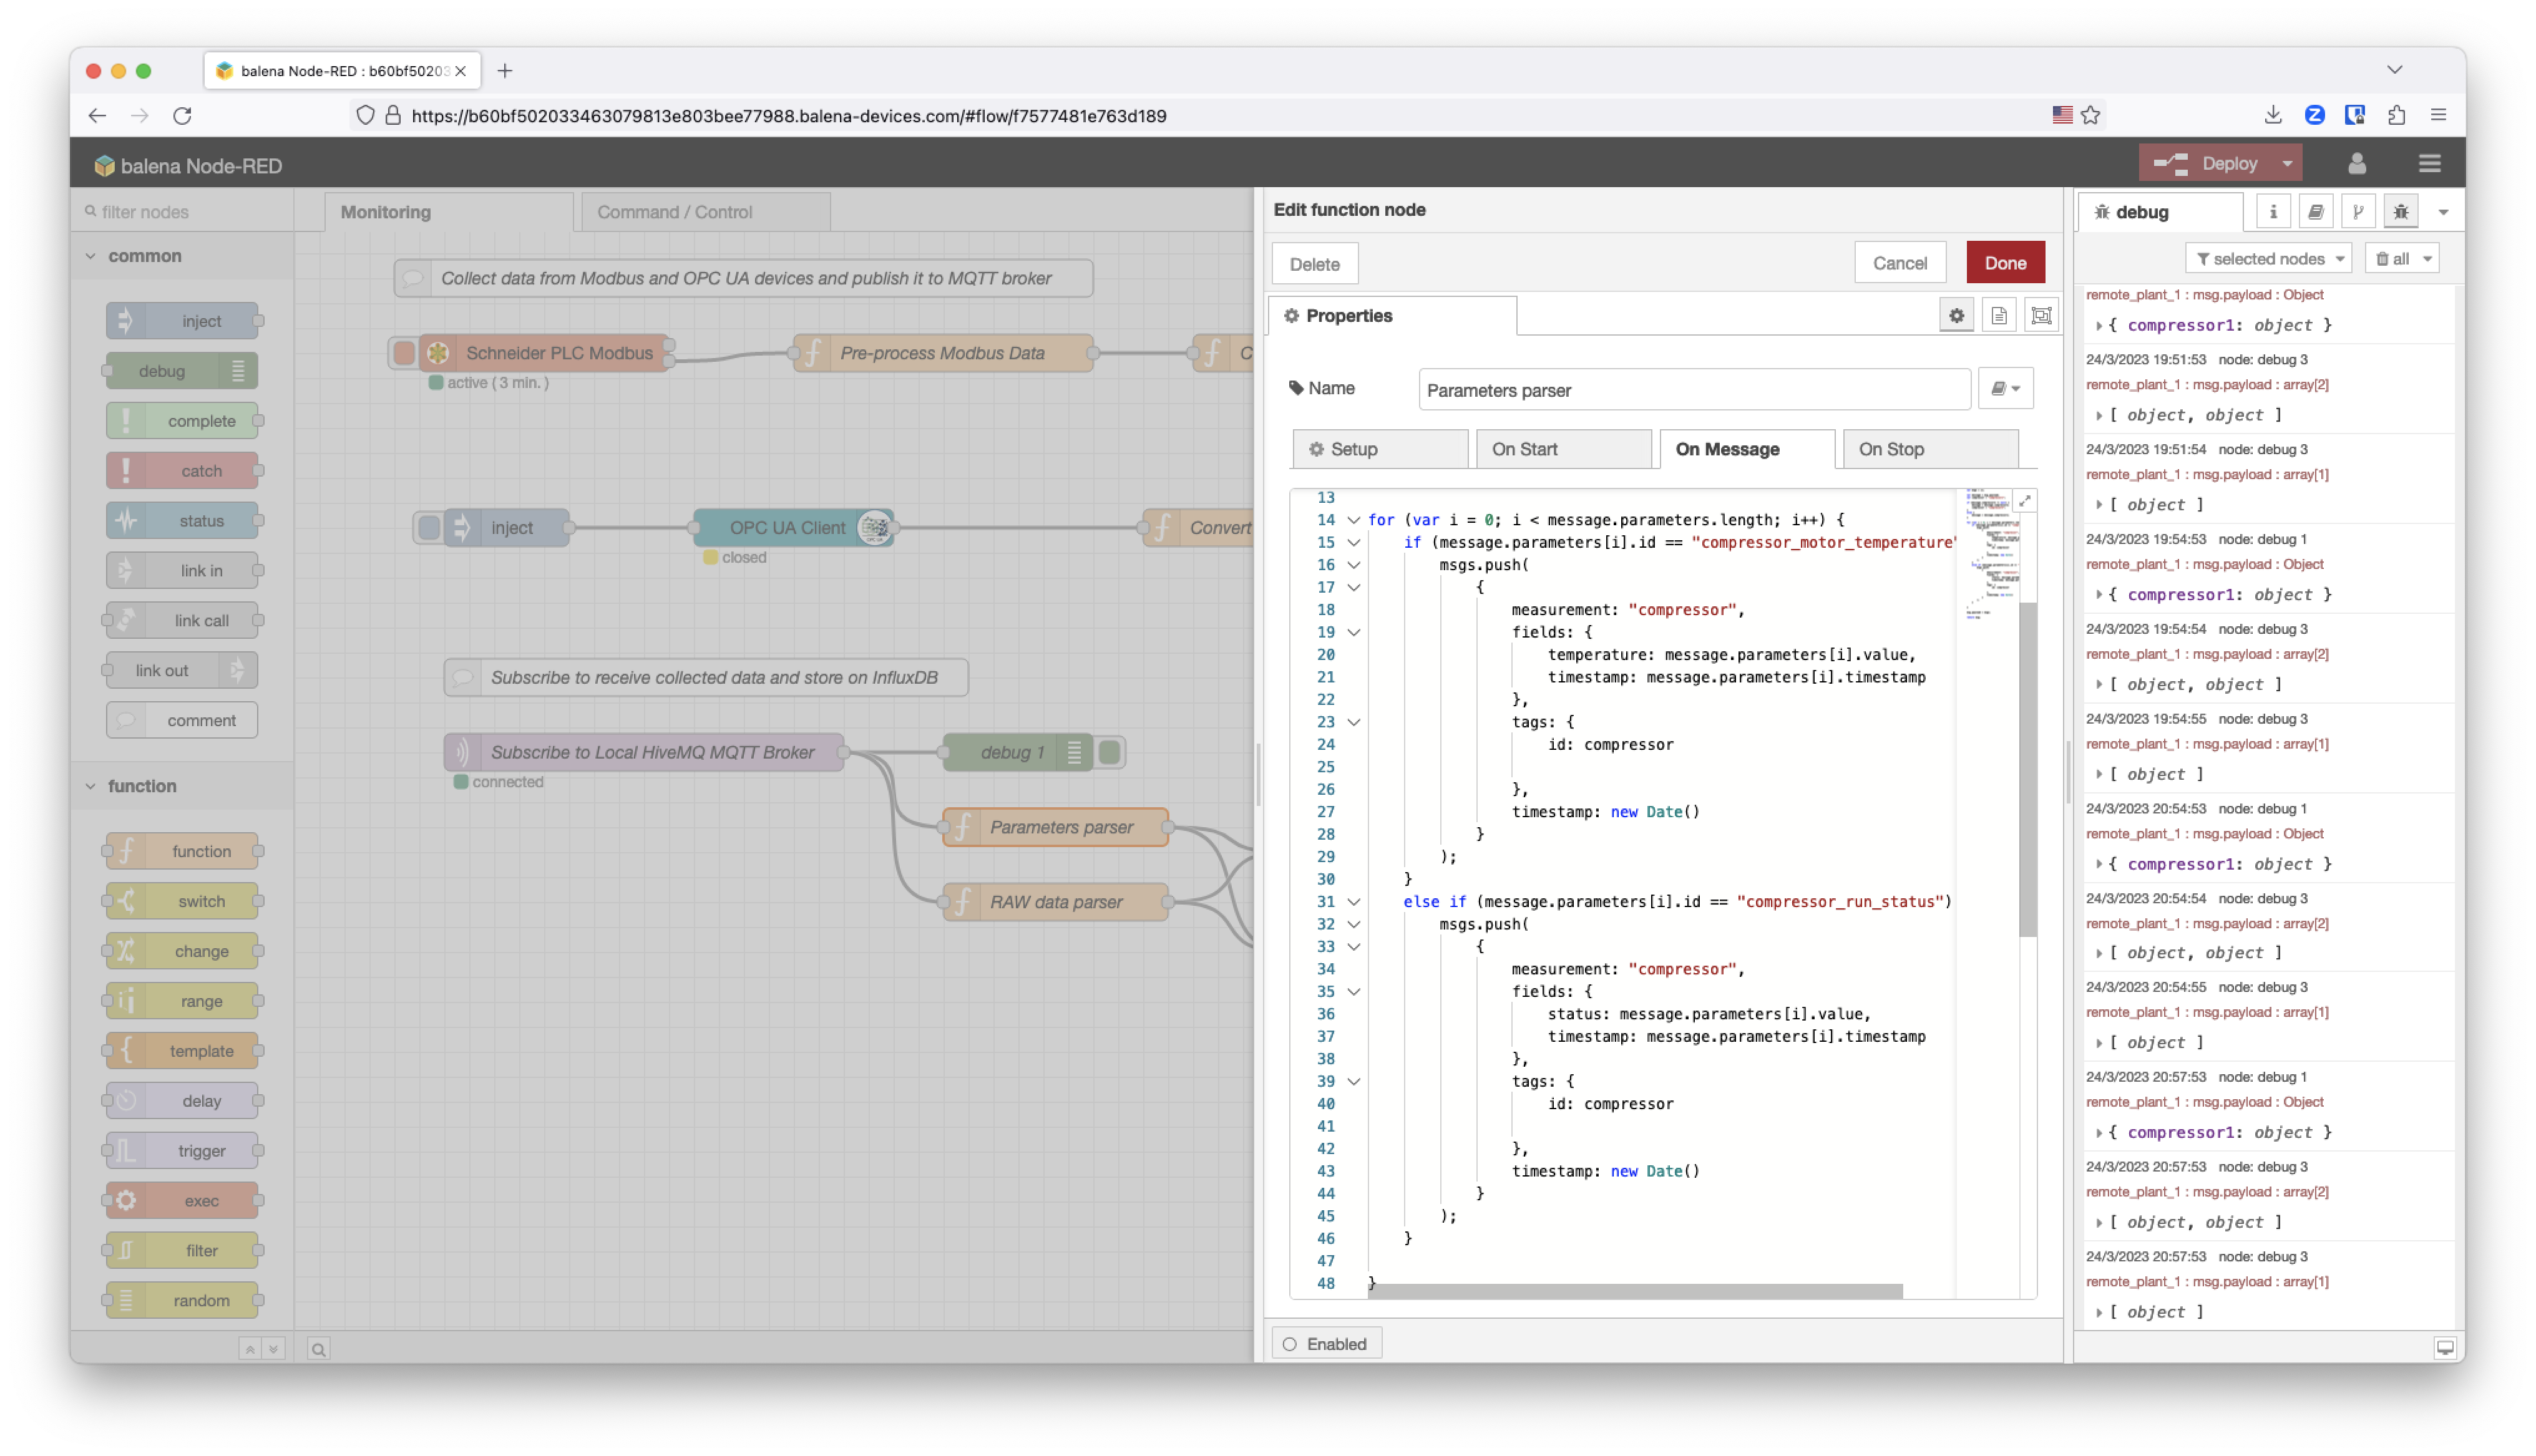
This is the RAW data parser function, which is in charge of storing the raw data received through MQTT with a timestamp and the compressor as ID.
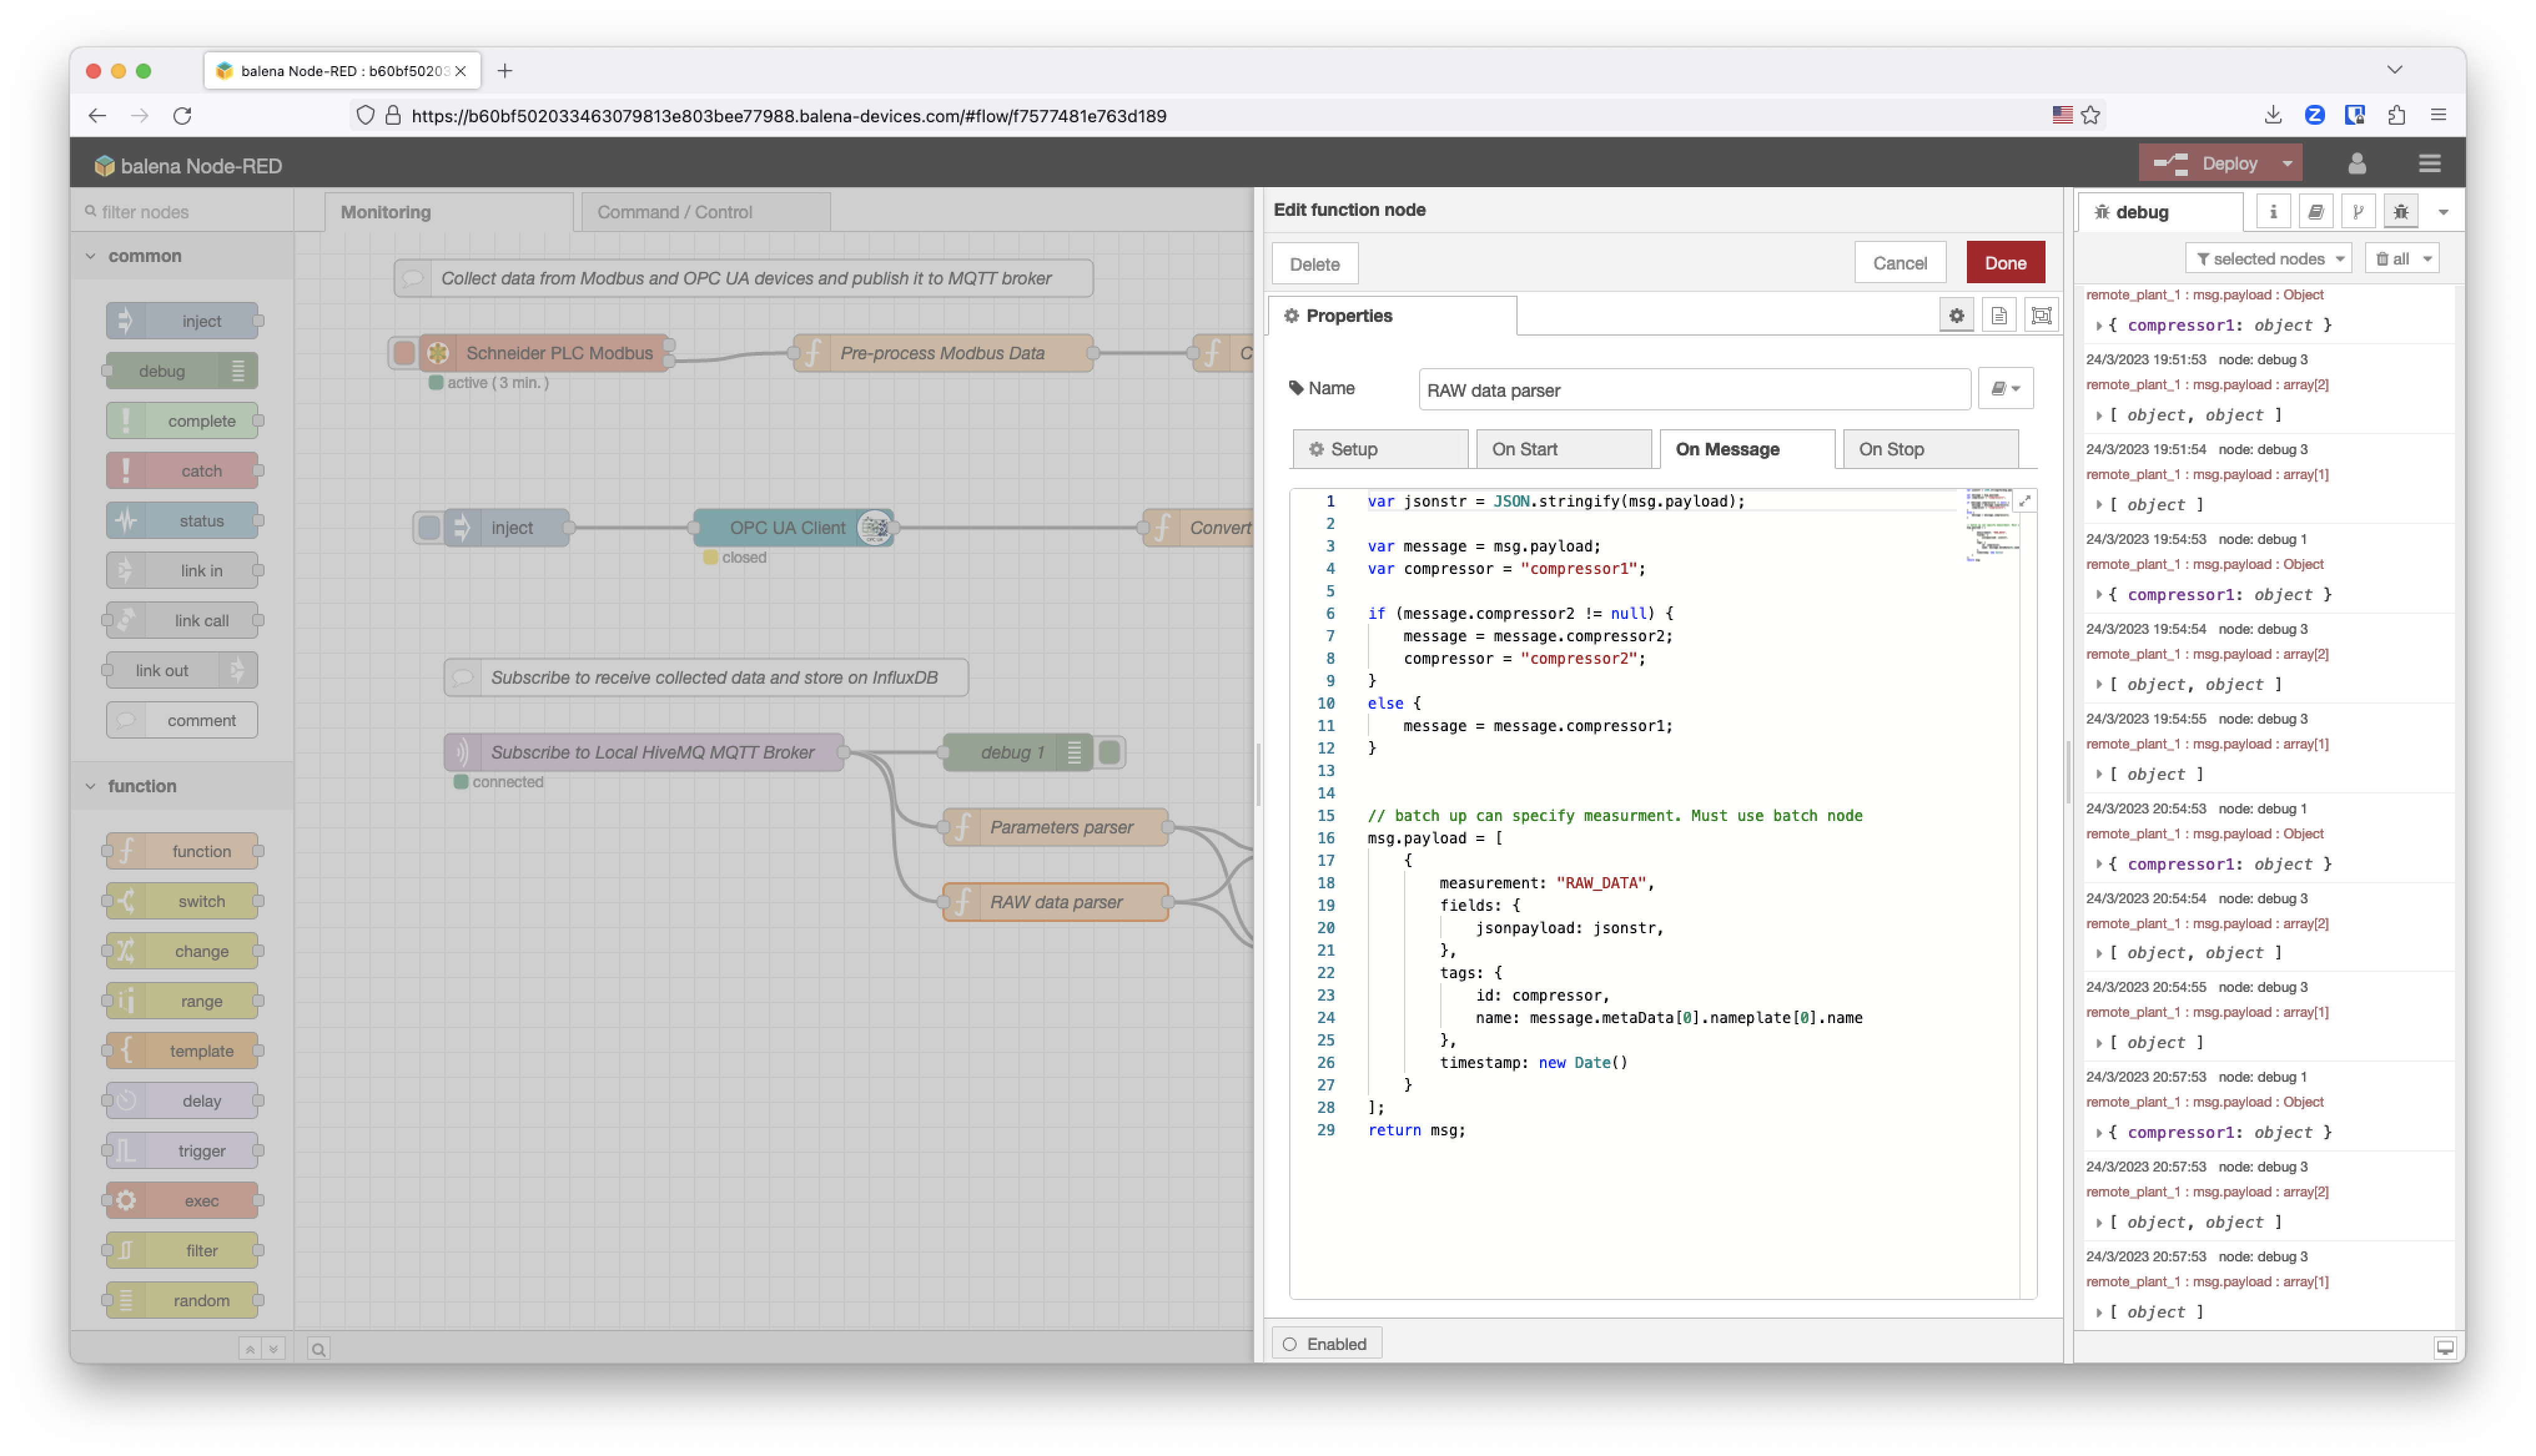
And this is the compressors data parser dummy function that we created for this application. We followed the payload recommendations by InfluxDB on NodeRED.
Grafana
Finally, to visualize the data we are using Grafana reading from InfluxDB as a Data Source.
To access Grafana you will need to use the port 3000 with your local IP address. Use the credentials admin and admin to access Grafana initiallty.
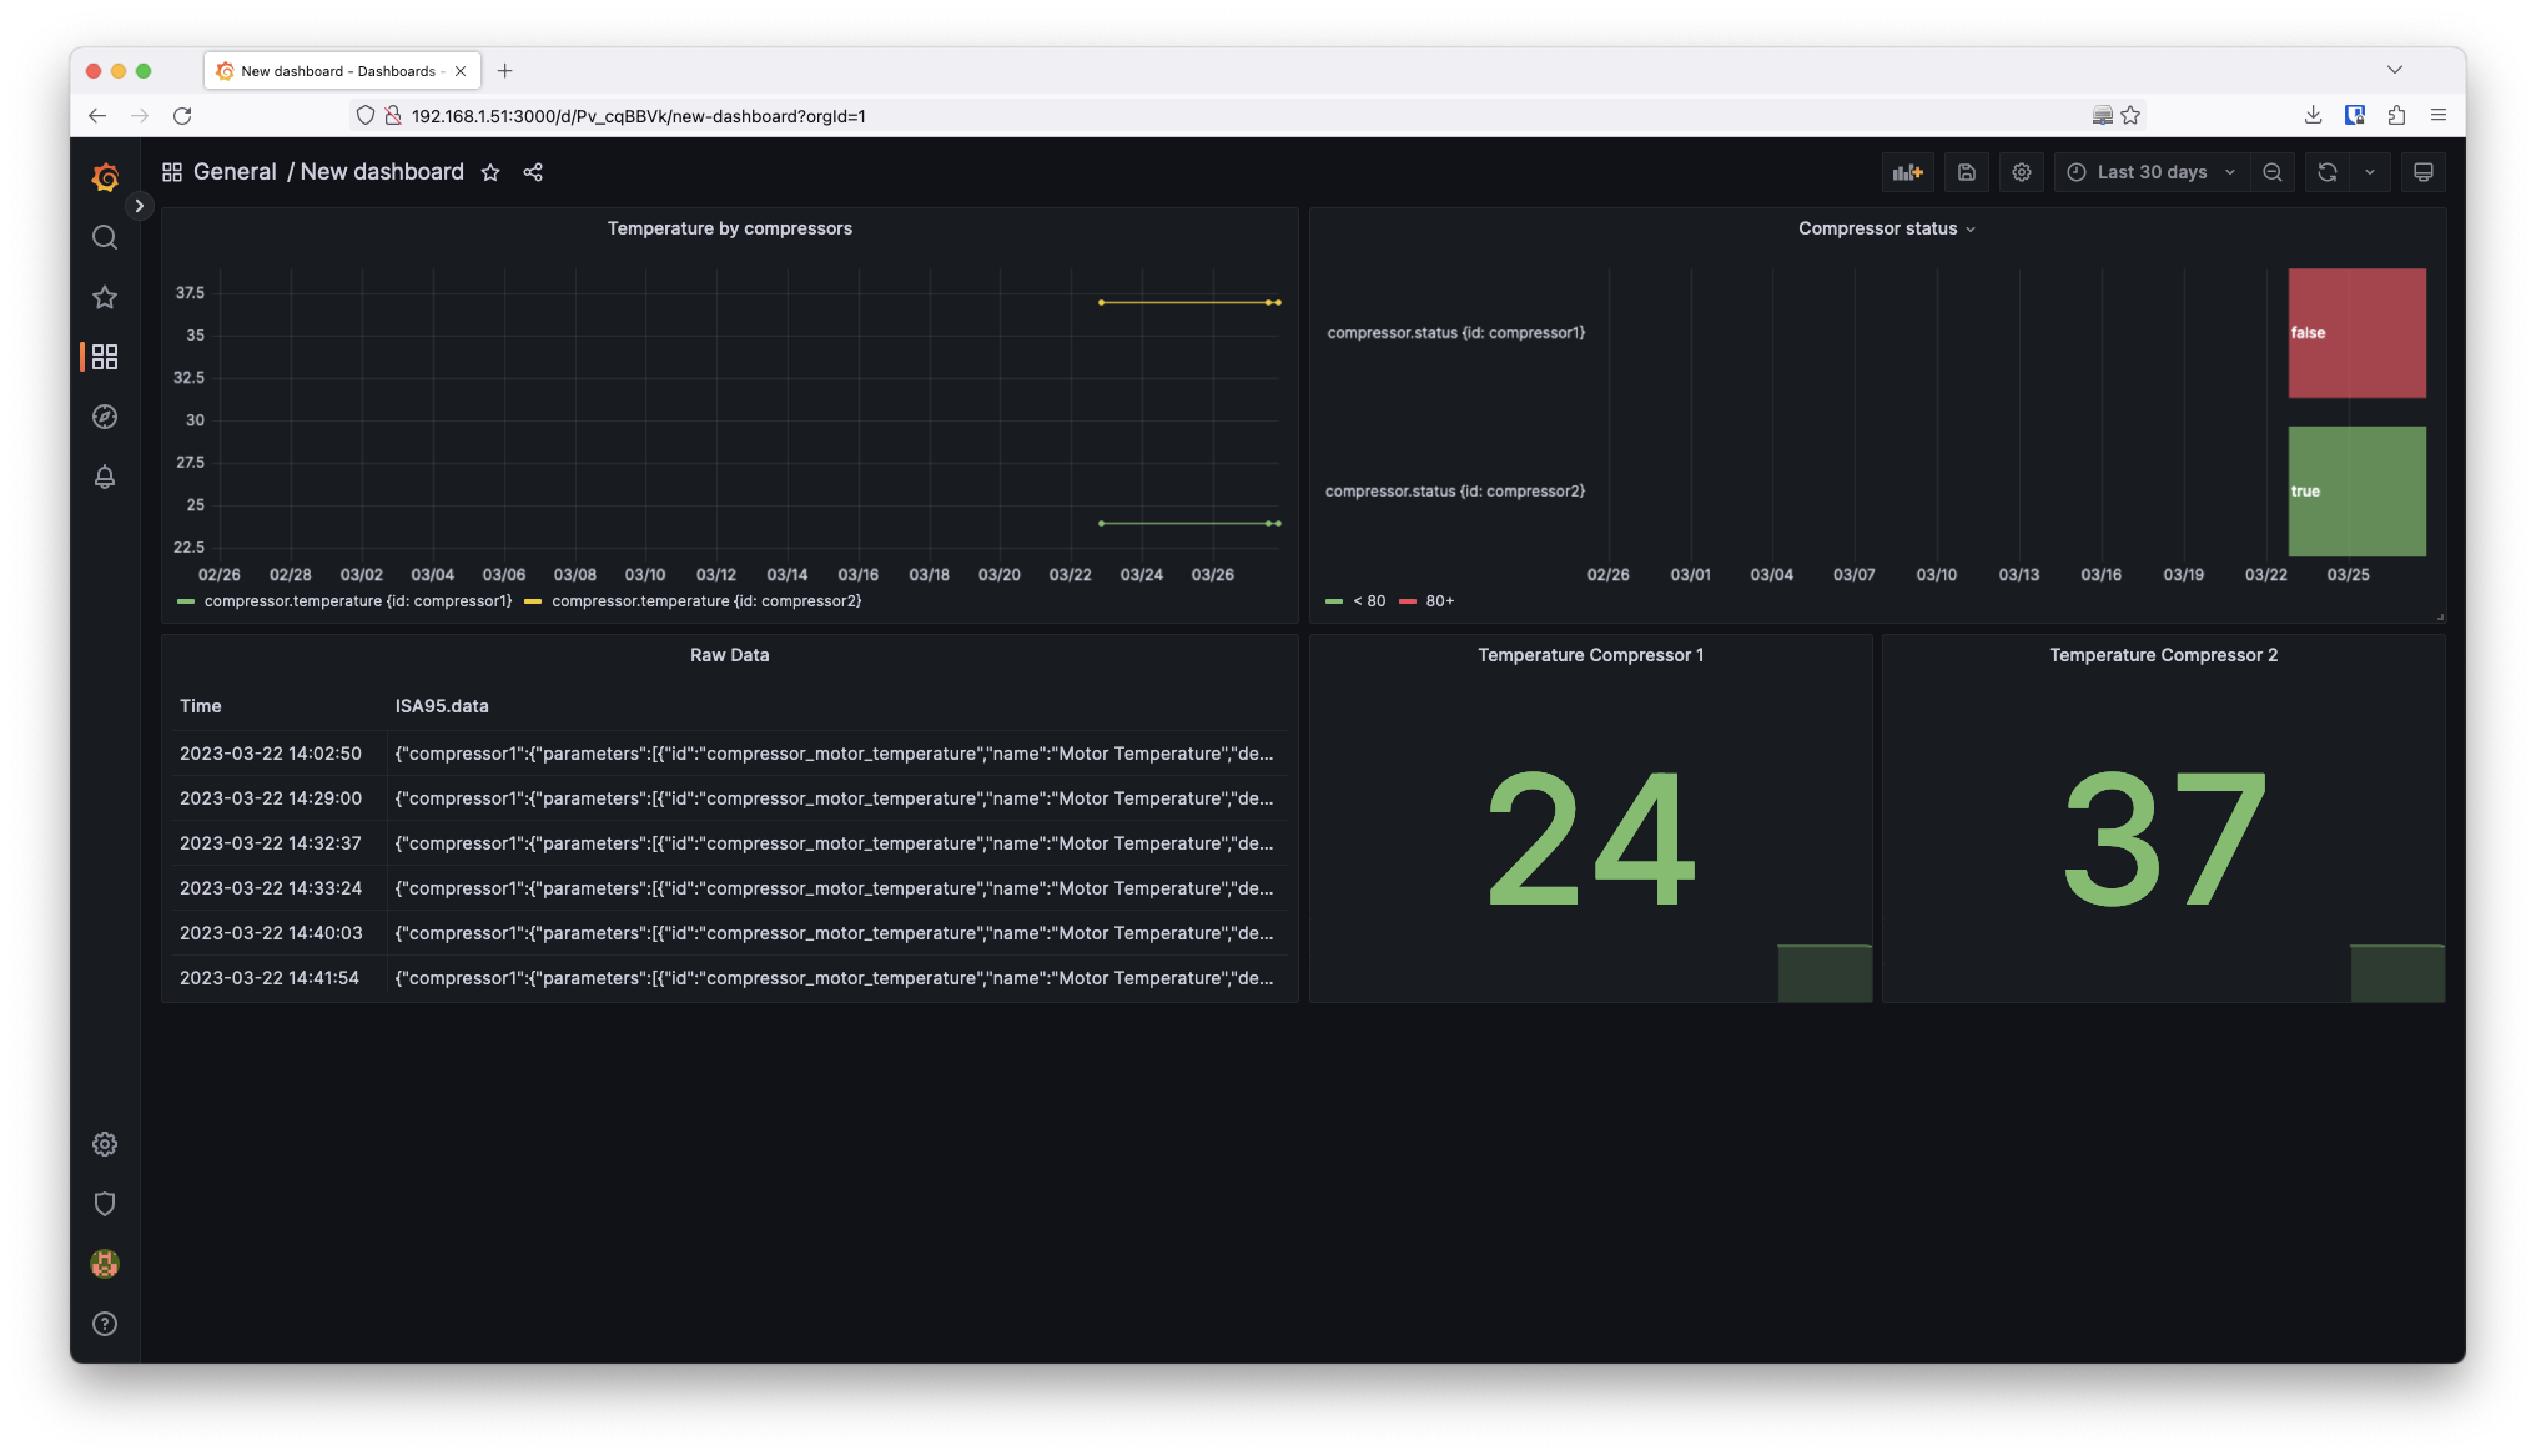
This is the real-time dashboard generated with Grafana using InfluxDB as a Data Source and querying the compressor and the raw_data measurement.
Add an interactive dashboard
Until now we have created a dashboard that visualizes data coming from the machinery on the plant floor. However sometimes it’s interesting to interact remotely with some elements placed there. This is why we have a Signal Light connected through OPC UA to the OT network.
NodeRED UI
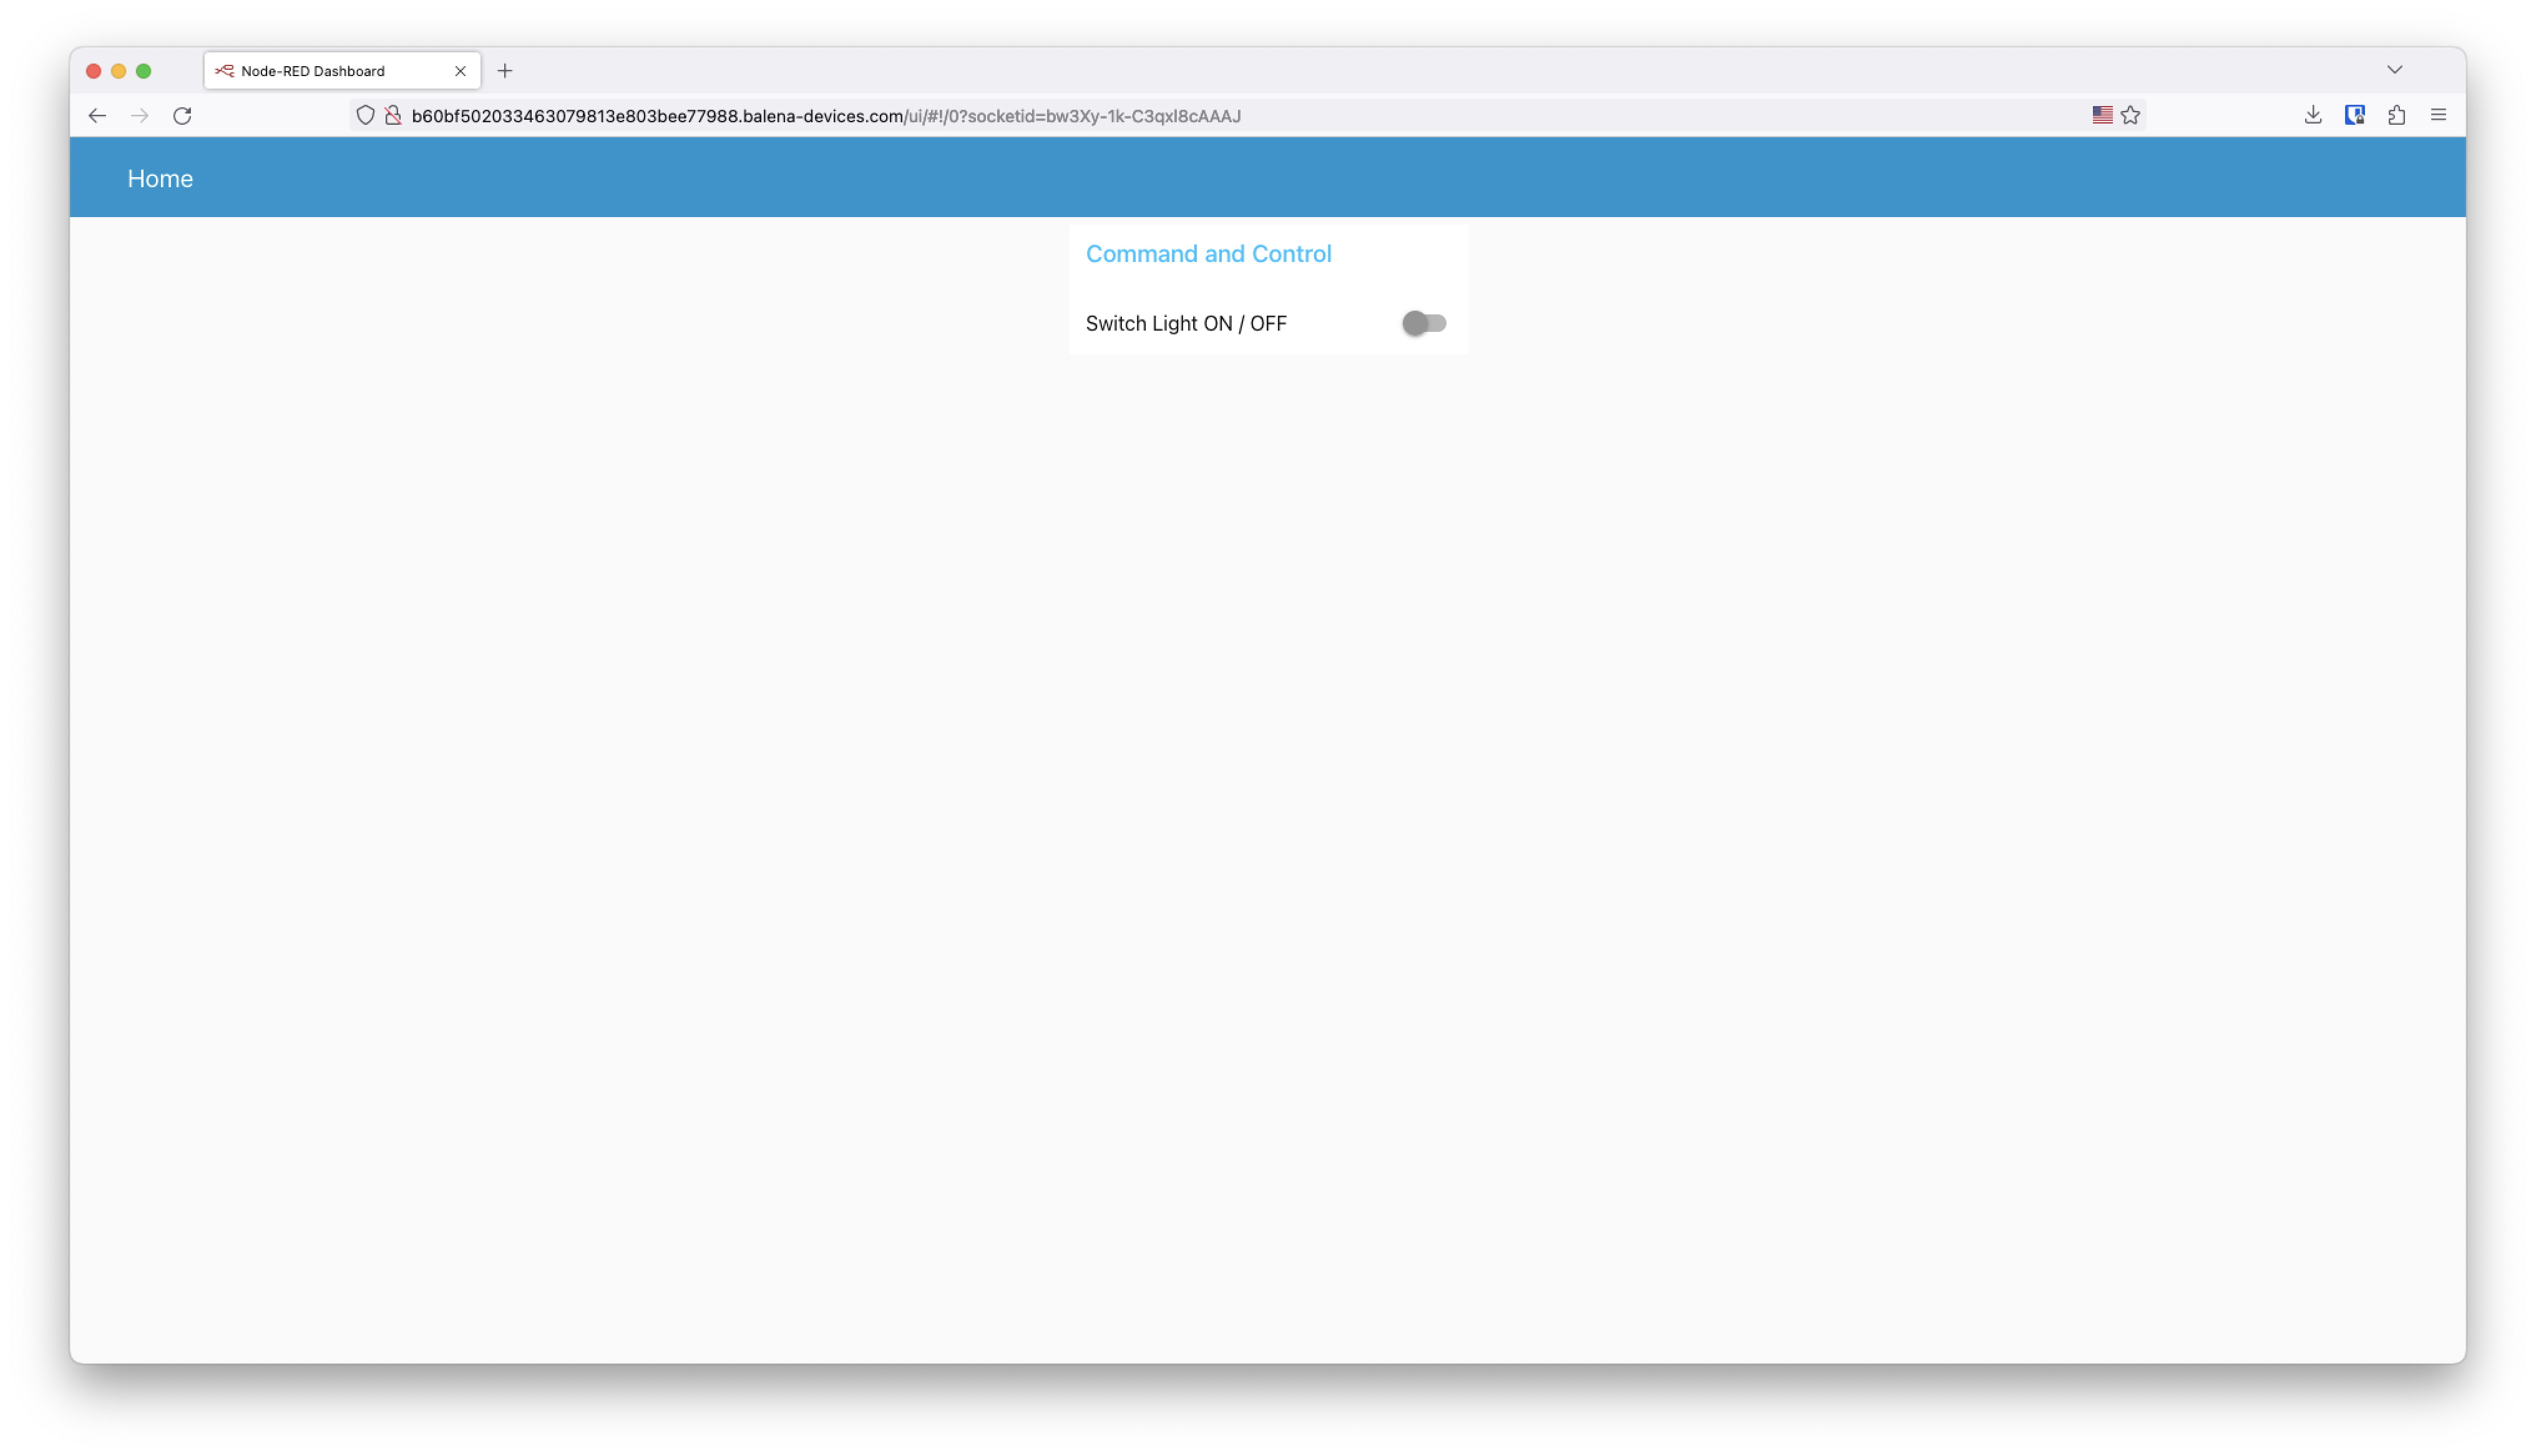
To provide an interactive user interface, we are going to use the NodeRED UI which allows you to create an interactive dashboard with data as well as widgets that can perform actions.
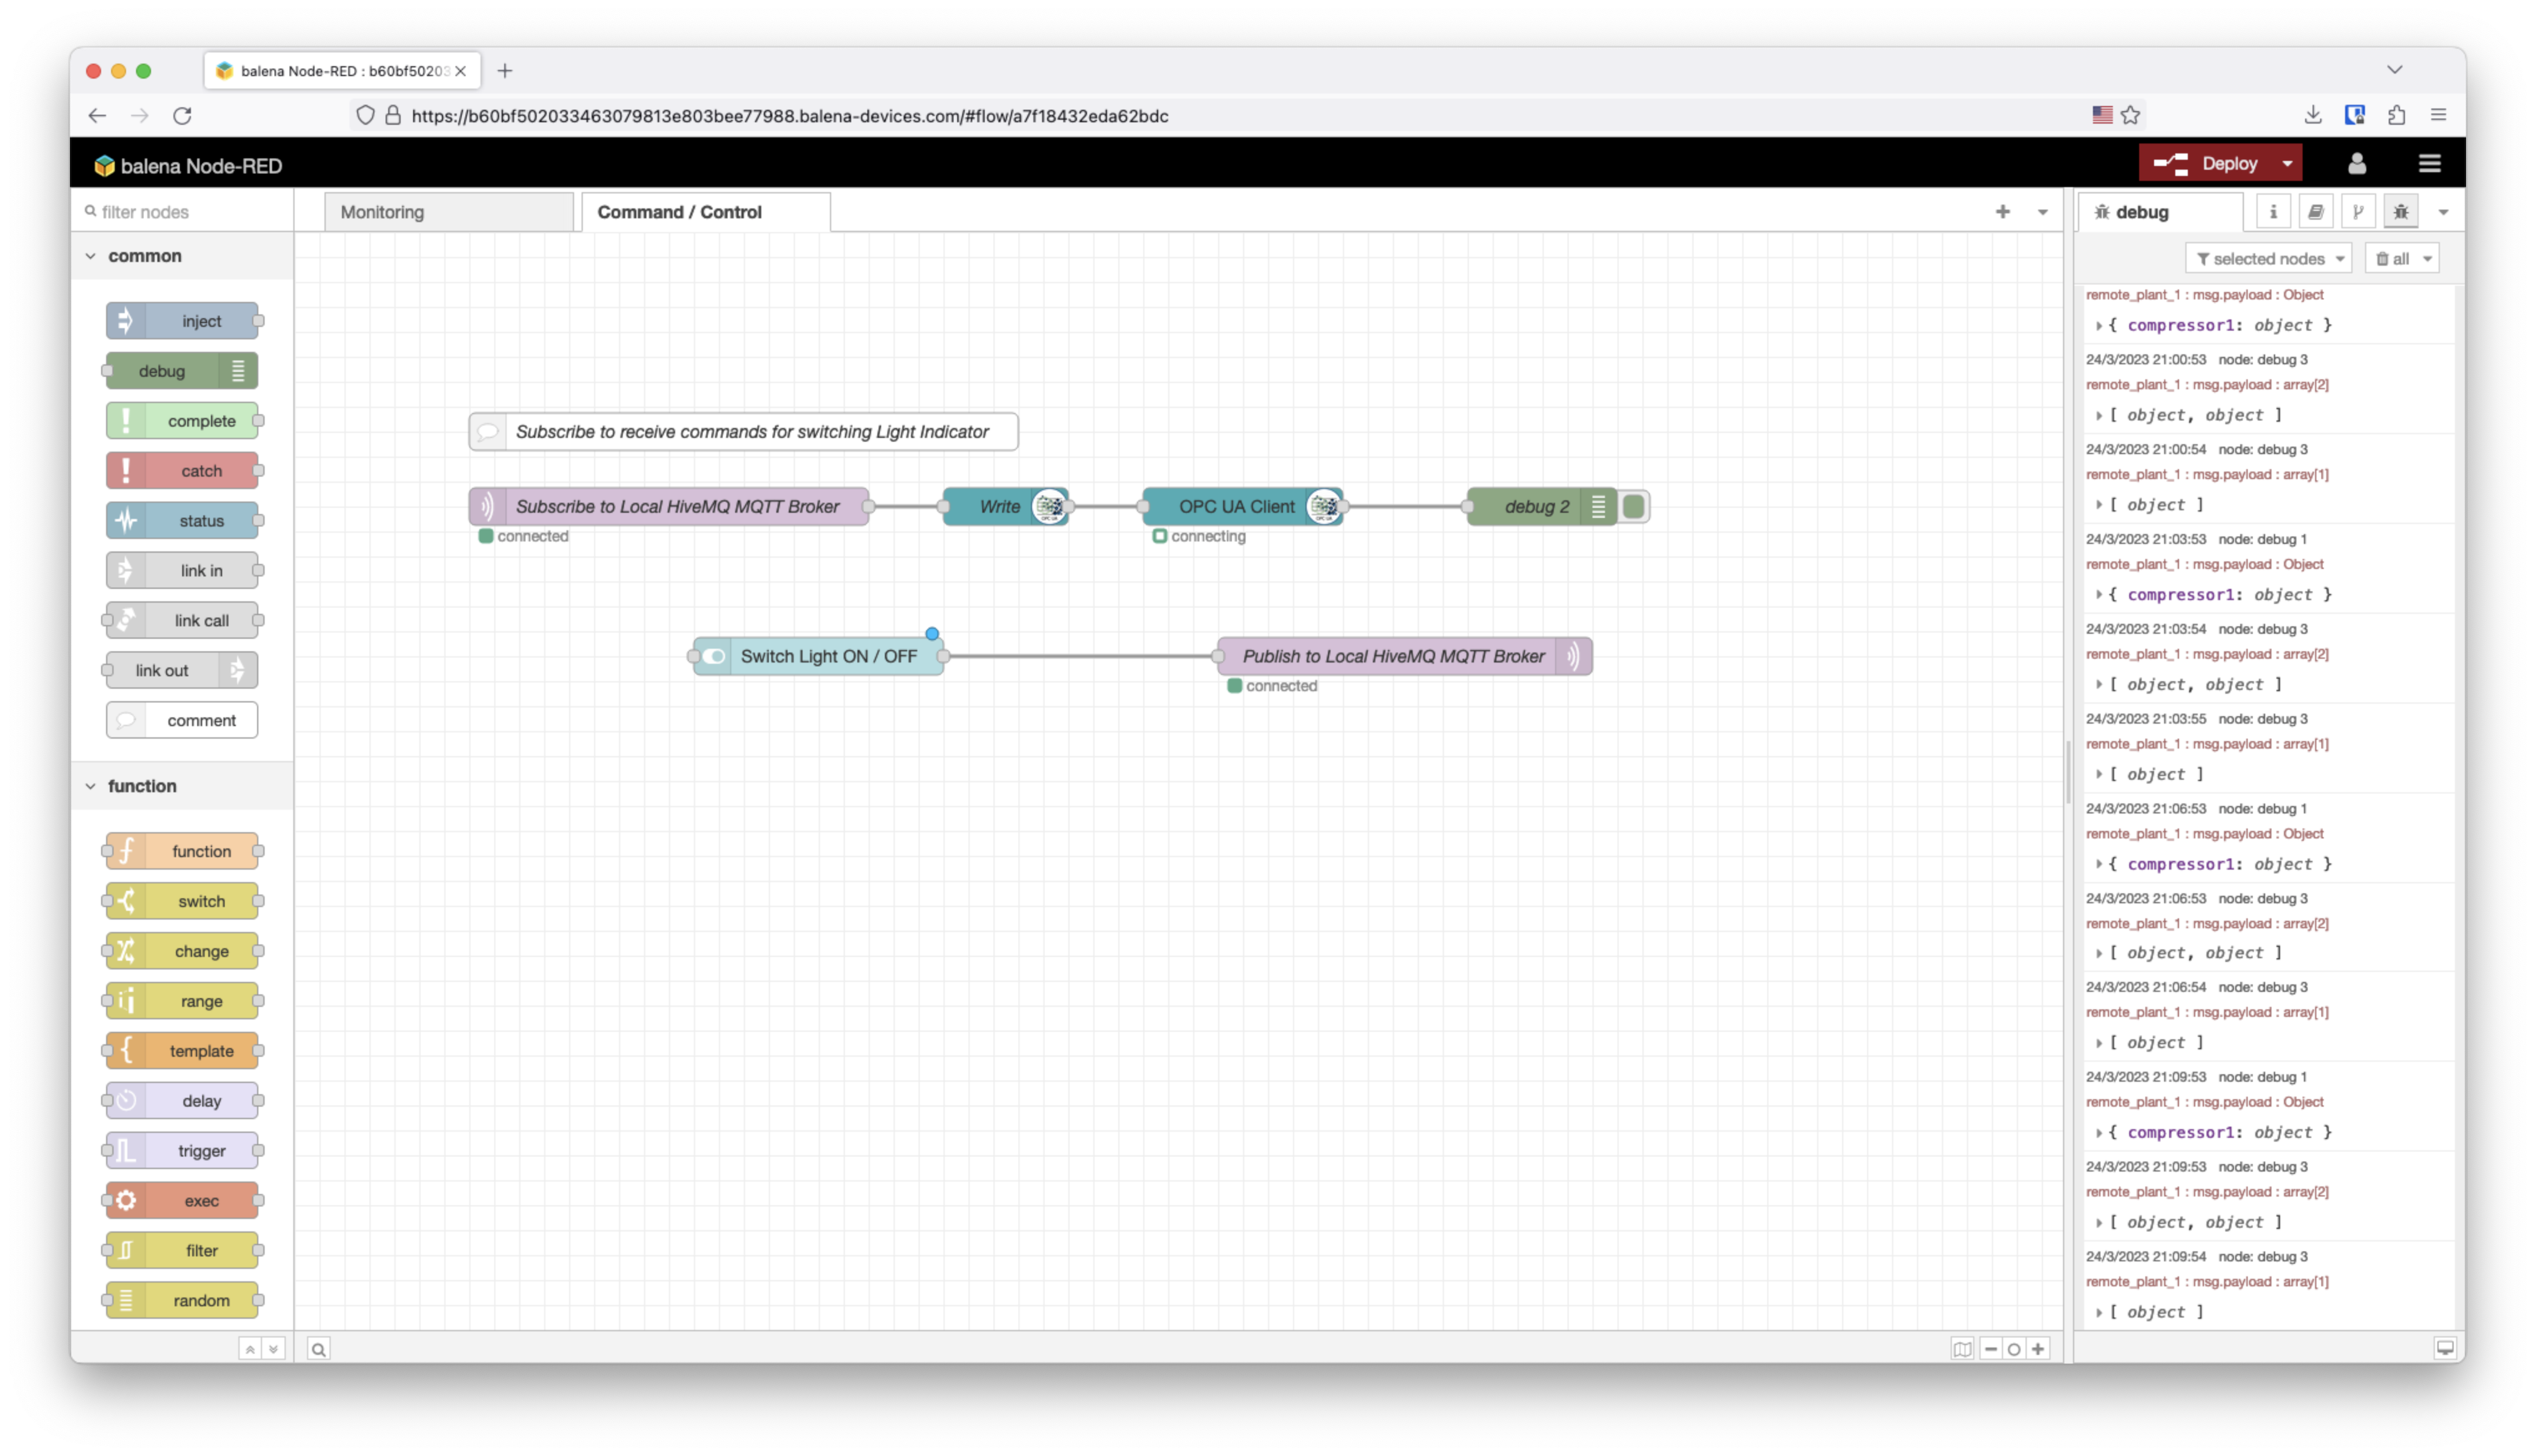
In this case, we are going to use the switch node that will publish a boolean to a specific topic. On the same flow we will have a subscription that will write through OPC UA the received value to the Signal Light as you can see below on the NodeRED interface.
What’s next?
In the next blog post of the Industrial IoT Edge gateway series, we are going to explain how to expand from one plant floor to multiple ones. Using the same reference architecture with HiveMQ MQTT broker cloud solution bridged from the HiveMQ edge broker with balena for each site. With all the data collected on a central MQTT broker we will use a cloud dashboard platform to visualize the data from multiple sites.

In the next blogpost we are also going to showcase how to add Ignition to the MING stack to use the Unified Namespace concept with MQTT Sparkplug on HiveMQ and balena.
balenaHub
You can find the “Industrial IoT Gateway Architecture Reference with MING using HiveMQ and balena” on balenaHub, the balena marketplace platform for finding applications and blocks. And you also can find this project in the Github repository
Furthermore you can use the HiveMQ 4 balena Block in case you need to add a MQTT enterprise broker on the edge with a block.
Feedback
The balena platform is all about reducing friction for fleet owners. As always, let us know if you run into any issues when following this guide or getting the Industrial IoT gateway reference architecture set up in your factory or industry plant floor.
Feel free to add a comment below or contact us on our forums.
Thank you for dropping in an Opto 22 #RIO into your architecture diagram! Just a heads up that it is heavily underutilized in this drawing because we can run Influx, Grafana, or brokers inside the RIO itself. Maybe it is time for us to start looking at putting Balena inside the RIO? We would be open to that conversation.
If you’d rather just use the RIO as simple I/O you can do that to as you mentioned with OPCUA but also via MQTT, RestAPI, Node-RED nodes, or even Modbus/TCP.
Again that you for posting this excellent article and I hope that we can discuss a closer collaboration between our two companies.
Rene Gamero
Opto 22
Yes @rgamero that sounds like a great idea! Write me a private message please
Hi Marc, this is a really cool ref architecture! I wondered if you could explain more about the integration of the PLC running a Modbus server to Node Red. I ask because I have a PLC to which I want to deploy a similar solution however the PLC vendor has told me that I need to use their specific gateway which of course ingests data into a proprietary database to which I have no access to easily extract/enrich data. I know that I can run a Modbus server on the PLC but how do I map the data from devices to some kind of data model that I can then use to show data upstream e.g. in Grafana? Thanks for your help!
@jrichard did you succeed integrating the PLC with a Modbus Server to NodeRED on your Edge IIoT Gateway?