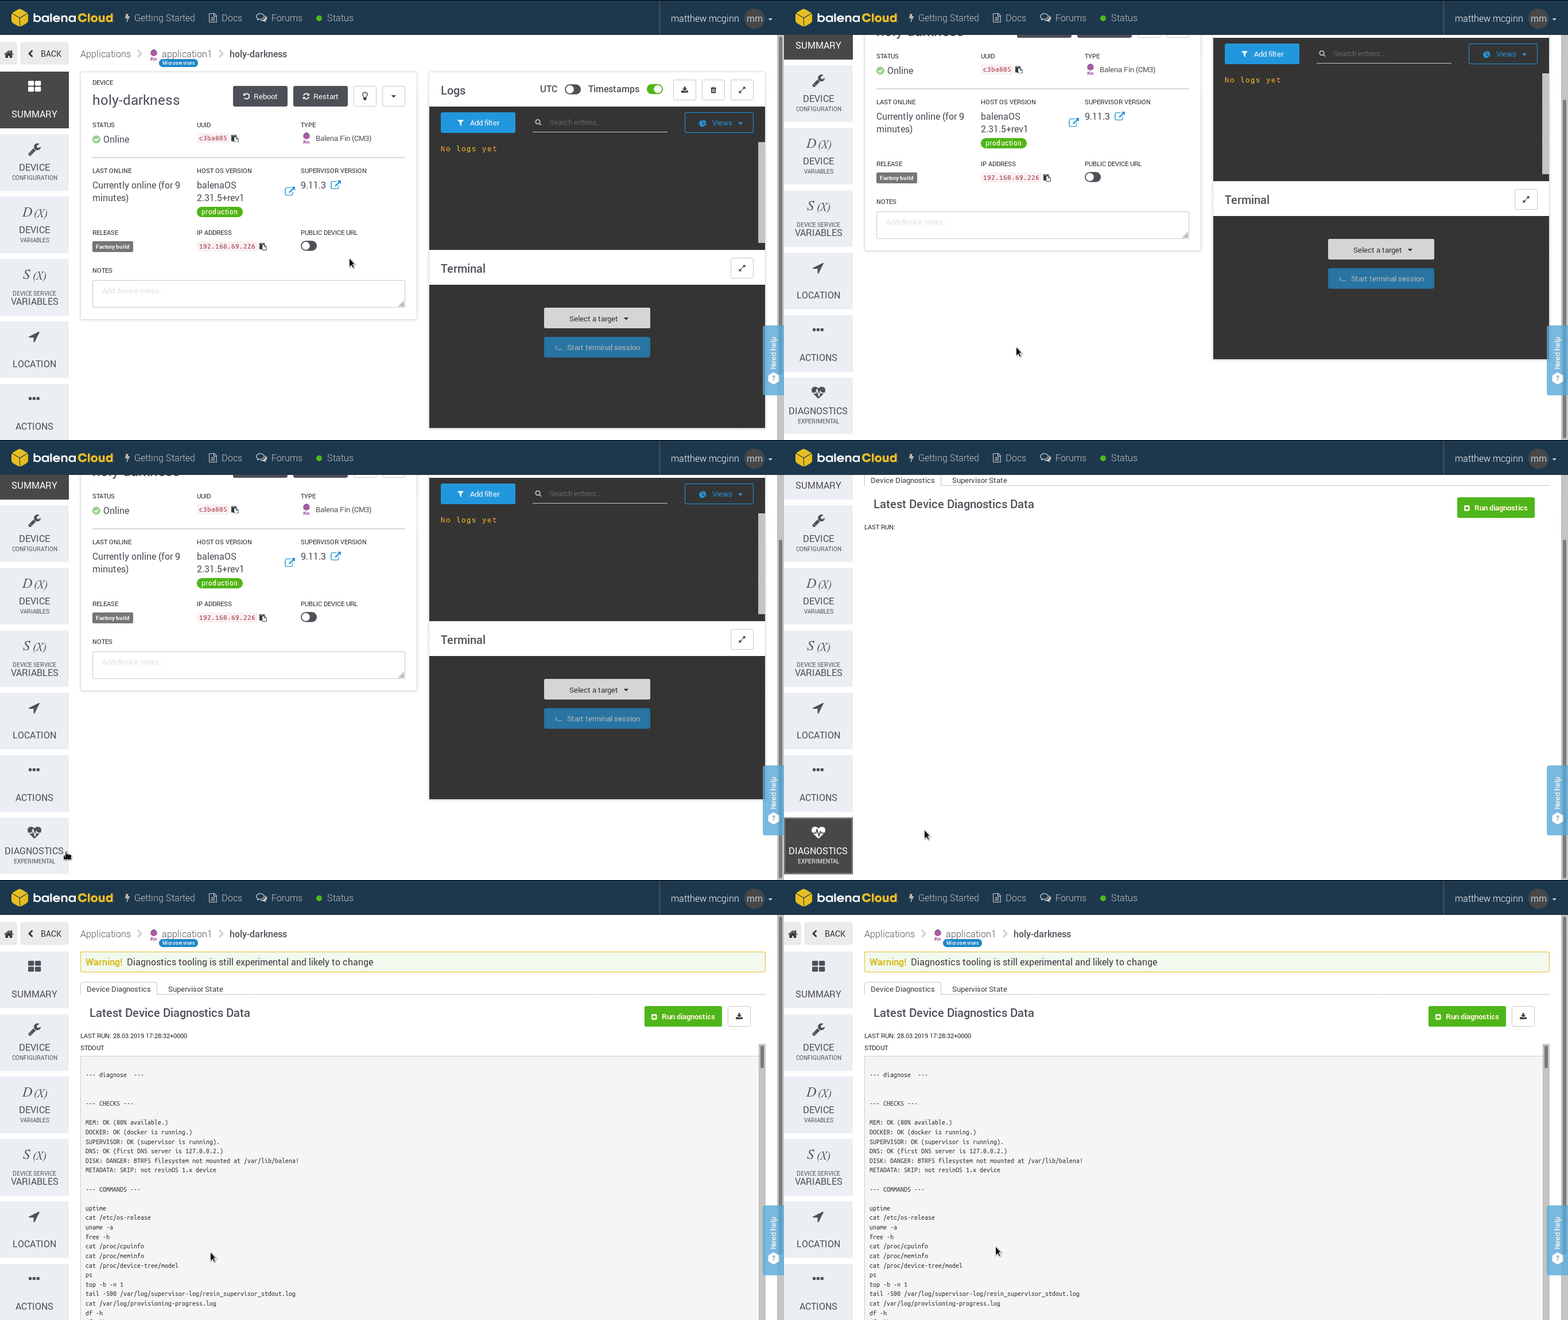
Today, we are happy to announce that we are making our internal diagnostics tooling available to balena users. The tools will be accessible by all application Owners as well as Developers. These diagnostics tools contain much of the accumulated knowledge of pathologies and issues that often arise on devices deployed in the wild. We are planning to open-source the underlying scripts shortly, but wanted to make these tools available today to provide users with a better understanding of their devices. Additionally, since these tools are the same ones that the balena team uses to diagnose and support user issues across all types of devices, they will continue to evolve as balenaOS does.
What do these tools do?
First and foremost, these tools are meant to explore and preserve the state of a device at a given time (when the tool is run). We have found this process useful for continued debugging after the device has been returned to proper working order. Since we have a snapshot of the state, we can continue investigating the issue using that snapshot without fear of losing data.
What data do these tools preserve?
We preserve what we would like to have available later, such as logs, counters, connection test results, procfs trees, runtime configurations, and filesystem statistics. We have found these various data sources to be immensely useful for post-hoc debugging. While there is no one right way to use these data, skimming through them can be helpful in identifying where a problem may exist. If you are still unable to identify the faulty subsystem, at the very least you have data to share with experts in the subsystems that may be involved!
What is coming next for these tools?
As these tools primarily drive our support efforts, we are continually refining them as we learn more and expand our footprint of supported devices. We are also aiming to make these tools more predictive in nature, with the ultimate goal of self-diagnosis and/or automatic escalation. We believe that working towards predictive failure detection and mitigation will vastly improve the lifecycle of a fleet (and the mental health of fleet owners!).
You can access this new feature by navigating to a device summary page, and scrolling to the bottom to select “Diagnostics (Experimental)”. Note that since this feature is still experimental, it is liable to change at any point.

Diagnose your fleet now and let us know what you find! If you have any questions, feedback, or suggestions it’s all welcome. You can always reach us in our forums at https://forums.balena.io, on Twitter @balena_io, on Instagram @balena_io or on Facebook.

