

Welcome to version 2.0 of balenaSense, featuring a number of radical changes that rendered previous guides somewhat outdated. Using an outdated guide is no fun, so, we present a new project tutorial for balenaSense v2.
balenaSense was designed to make it easy to take temperature, humidity, barometric pressure and other readings from sensors and provide a dashboard to see this information at a glance. The inclusion of balenaBlocks allows us to simplify its build and streamline some of its functionality. We hope that it also inspires other edge developers to try putting these and other blocks together to create their own projects.
Just like with balenaSense v1, once you have your initial hardware ready, and you successfully deploy the project to your device, you can scale to as many devices as you’d like, assuming you have all the hardware you need.
What Changed from v1?
Under the hood, v2 is a completely different architecture, using “blocks” instead of custom code and config files. You can read about those details here. As a result of this change, balenaSense now supports a wider variety of sensors (see the list below) as well as multiple sensors on one device.
Air quality measurements using the BME680 sensor are no longer supported due to their reliance on proprietary software that had recurring project-breaking changes. We hope to add an open source solution in the near future to reinstate this feature.
To read about the v2 changes in more detail, check out the project’s readme.
Contents
- Getting started
- Hardware required
- Software required
- Tutorial
- Hardware setup
- Deploying the software
- Booting the device for the first time
- Viewing the dashboard
- Aggregate your data
- Integration with Home Assistant
- Push data to Home Assistant from balenaSense
- Use a sensor attached to a Home Assistant device
- Going further
- Until next time
Getting started
We’re going to look at monitoring temperature, humidity, and barometric pressure using an all-in-one sensor that connects directly to a Raspberry Pi with no additional components required. You don’t need any experience in electronics or soldering. This project implements a database to store historic readings along with a web interface to see current readings and trends at a glance.
Hardware required
- A Raspberry Pi 2Bv1.2/3B/3B+/3A+/4B
- 16GB (or larger) Micro-SD Card (we recommend Sandisk Extreme Pro SD cards)
- Power supply and cable
- A compatible sensor such as the ones in the table below
BalenaSense works with the following I2C sensors:
| Sensor Model | Sensor Name |
|---|---|
| BME680 | Bosch Sensortec BME680 sensor |
| BMP180 | Bosch Sensortec BMP180 sensor |
| BMP280 | Bosch Sensortec BMP280 sensor |
| BME280 | Bosch Sensortec BME280 sensor |
| MS8607 | TE Connectivity PHT sensor |
| HDC1000 | TI HDC100x relative humidity and temperature sensor |
| HTU21 | Measurement Specialties HTU21 humidity & temperature sensor |
| MS8607 | TE Connectivity PHT sensor |
| VEML6070 | VEML6070 UV A light sensor |
Many of these sensors now include a simple, solderless connector known as Stemma QT or SparkFun Qwiic. They allow you to daisy-chain multiple connectors together on the same device. If you’re using these types of connectors, you’ll want to get at least one cable such as this that terminates in pin sockets you can connect to the Raspberry Pi.
Software required
There are multiple ways to deploy the project to your device which are detailed below, featuring the balenaSense Open Fleet, where anyone can add a device without a balenaCloud account to try things out. In any case, you’ll need a tool to flash the SD card such as balenaEtcher. If you plan on cloning this project and making other changes, you’ll want to install balenaCLI as well.
Tutorial
Hardware setup
All of the supported sensors utilize a two wire serial communications bus called I2C (“eye-squared-see”) so the connection is easy. In addition to the two communication wires, there are also two power connectors for a total of four wires. The diagram below shows the typical color codes (in the arrows) for the wires that connect the sensors to the Pi.

You may find that the SDA pin is sometimes labelled SDI and the SCL pin is sometimes labelled SCK on certain sensors. You can use these pins if SDA and SCL are not available, as long as the sensor is in the list above and supports I2C.
You can daisy chain multiple I2C sensors together, or use various adapters as in the image below:

If you make your connections manually, just make sure you only connect similar wires together, such as SDA to SDA and SCL to SCL and so on.
Automatically sensing sensors
BalenaSense will automatically scan for connected sensors. Each connected I2C sensor has an address that must be unique. This is usually not an issue unless you connect more than one sensor of the same type. If this is the case, check the sensor’s datasheet to see how/if you can change the address of one of the sensors so they don’t conflict. There’s more information about this in the sensor block’s readme.
Deploying the software
You have three options to deploy the software. You only need to choose one of these three options to begin.
You can join our “open fleet” for balenaSense
This is the fastest option for getting started, as you don’t need to have a balenaCloud account. Follow the directions there to flash an SD card, insert it into your device, and download and run balenaSense. (For more information about using balenaSense, see the “Device first boot” section below)
Cloning the project (for advanced users)
Advanced users can clone the project from GitHub and use the balena CLI to push the application to their device. This is the best option if you want to tinker with the project and have full control.
Our Getting Started guide covers this option. (Follow the steps below for the third option after you have created an application and pushed the code using the CLI)
Use Deploy with balena
Sign up for a free balenaCloud account (your first ten devices are free and full-featured!) and then use the button below to create and deploy the application:

You should see a modal that looks like this:
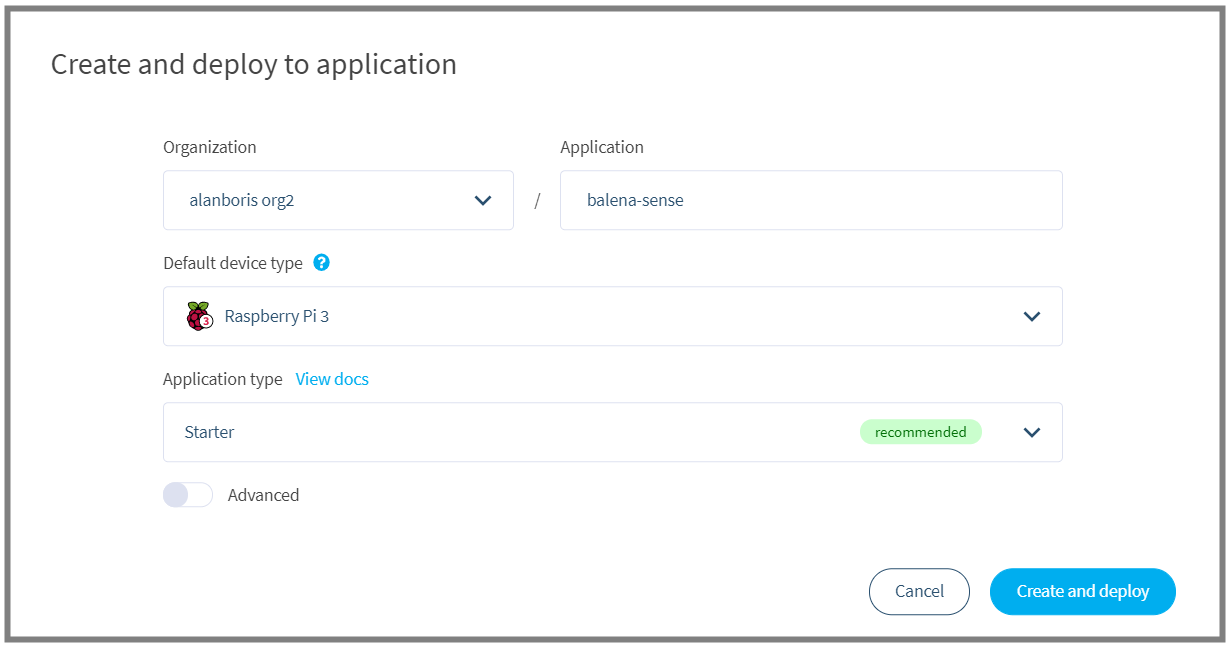
You can name the application whatever you’d like. Push “Create and deploy” and you’ll see a new application with that name show up in the dashboard.
Once your application has been created, you can set up and add a device within that application by clicking the “Add device” button. When you add a device, you specify your device type, and if you are connecting to a wireless network you can set your WiFI SSID and passphrase here too.
Note: we’ve used a Raspberry Pi 3 in the image below but be sure to select the correct device type for the device you are using!

This process creates a customized image configured for your application and device type and includes your network settings if you specified them. Once the OS image has been downloaded, it’s time to flash your SD card. You can use balenaEtcher for this.
Once the flashing process has completed, insert your SD card into the Raspberry Pi and connect the power supply.
Booting the device for the first time
When the device boots for the first time, it connects to the balenaCloud dashboard, after which you’ll be able to see it listed as online and move onto the next step.
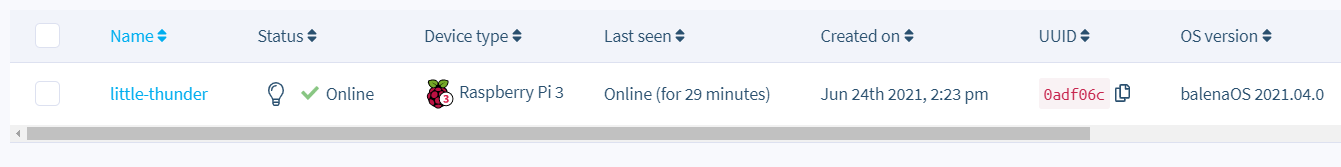
If everything worked out correctly, after a few minutes your device information screen in the dashboard should look something like this, showing the services running, one for each of the software components. (If not, check out our troubleshooting guide or head over to the forums where we can help you out.)

Viewing the dashboard
One of the great benefits of using a free balenaCloud account is that you’re able to use the Public Device URL feature.
Enable this toggle on your device (red encircled area below) and click the blue arrow to access the dashboard; you can share this link or bookmark it for use from your phone or another mobile device. As long as your balenaSense device is online and working, you’ll be able to access your dashboard from anywhere!

If you don’t want to enable the public device access, you can still view the dashboard from within your own local network by using the IP address value from the image above (green encircled area.) Yours will be different, but if you enter https://
When you first open your dashboard, you should see the default page with a summary at the top and collapsed views for each of the measurements provided by your sensor(s). Click on one of the arrows to the left of the measurement to expand that section and see the historical data. Initially you may want to change the time frame using the dropdown in the upper right from the default of “Last 12 hours” to something shorter so the graph isn’t squished to the right.

If you’d like to make changes to your dashboard, you’ll need to sign in to Grafana using the button with the arrow in the lower left corner.

The default username and password is admin. When you sign in for the first time, you will be asked to change the default password. This is a very good idea if you will be using the public URL and exposing your dashboards to the internet.
You may want to save a copy of your default dashboard before making any changes. Click on the gear icon (“dashboard settings”) at the top of the page, then click the “Save As…” button on the left side of the General settings page. Grafana has many customization options, so don’t hesitate to experiment with a copy of the dashboard.
To edit any panel in the dashboard, click the down arrow next to the reading name (such as “Temperature”) and click “Edit.” Changes to your dashboard are not saved automatically so if you make a mistake you can reload the page and everything will revert to how it was. If you make some changes you want to keep, hit save at the top of the dashboard and all of your settings will be saved to your device.

By changing the “Visualization” settings on a few panels, you can have a dashboard such as this:

Because balenaSense saves your dashboard data to a persistent volume, your changes will be saved even if you reboot or restart all of the containers on the device.
Aggregate your data from multiple devices and sensors
So far we’ve looked at a single device running balenaSense. What if you have multiple devices with sensors, for instance in different rooms of a home or office? Instead of needing to check the dashboard of each one individually, we’ll show you how you can aggregate their data together onto one dashboard so you can compare readings more easily.
In earlier versions of balenaSense, we outlined how to aggregate balenaSense data using InfluxDB Cloud. balenaSense 2 does not currently support using the cloud version of InfluxDB (although that may change in the future – let us know in the issues if this is of interest to you), so we’ll demonstrate how to aggregate data on one of our local devices. All of the devices we want to aggregate will need to be on the same network. You’ll still be able to use the Public URL feature to view this dashboard from any location.

While you could run balenaSense on multiple devices to aggregate your readings, we have a simpler project you can deploy to send data to a balenaSense instance. It uses just the sensor block component to send connected sensor readings via MQTT, a lightweight messaging protocol often used in IoT projects. The benefit of using the simple-sensor project is that it uses less resources on the device (and less SD card wear) and unlike balenaSense, it runs on a Raspberry Pi Zero. You can use the button below to deploy the simple-sensor to your device(s):
(From here on out, we’ll refer to the device running balenaSense as the “master” and the devices running the simple-sensor as the “node.” If you’re running balenaSense on all devices instead of the simple-sensor, just pick any one of your devices as the “master.”)
Since balenaSense already uses MQTT to transfer data, we only need to change a few settings to aggregate data from other MQTT sensors. On the master device, go to the “Device service variables” tab in your balenaCloud dashboard and add a service variable named MQTT_INPUT_STRINGS_FIELDS to the connector service with a value of short_uuid. The page should look similar to this after adding the variable:

This tells our connector block which string fields to accept, in this case short_uuid. (By default, the connector block only recognizes numeric field values)
On each of the rest of the node devices, add a service variable named MQTT_ADDRESS for the sensor service with the value being the IP address of the master device. In other words, if my master device’s IP address is 192.168.1.111, then the rest of the devices would have a variable that looks like this:

Once all of the variables have been set on all of the devices, click the restart icon on the connector service in the “Services” section of the balenaCloud dashboard.

This will allow the connector to find all of the new data from the other sensors and start saving it in the master device’s InfluxDB database. Now that the data is available in one database, we can construct a dashboard to compare similar sensor data from multiple devices.
On the master device, go ahead and open Grafana and sign in if you haven’t already. Click on the dashboards tab icon on the left (the four squares), select “Manage” and then click on the blue “New Dashboard” button.

Click “Add new panel” and then at the bottom of your new dashboard page, click the pencil icon to toggle the query text edit mode. (Although we can build a query with the handy visual editor, it will be easier in this tutorial to enter it textually.)
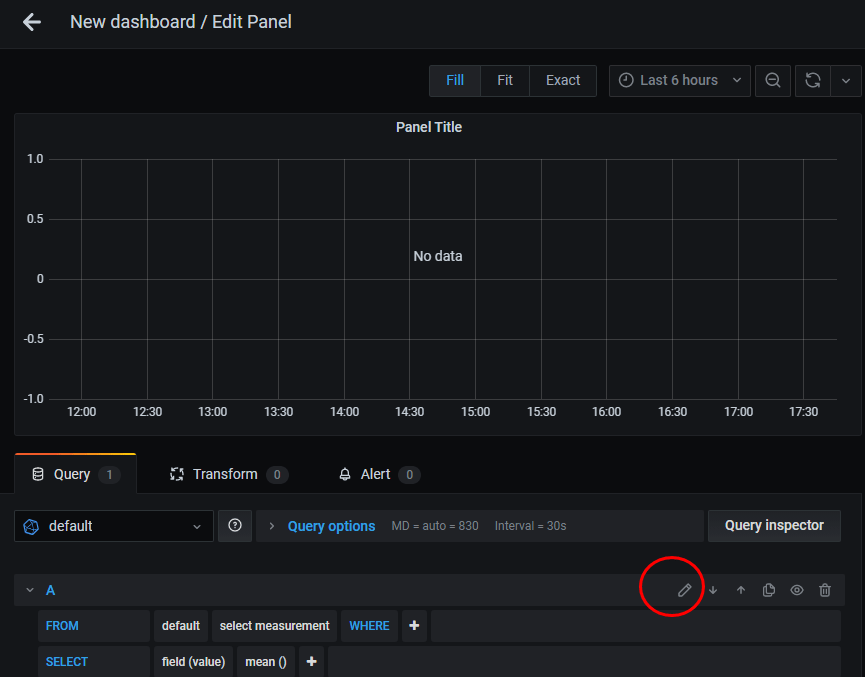
Replace the SQL text in the text box with the following:
SELECT mean("temperature") FROM "mqtt_consumer" WHERE "short_uuid" = '0000000' AND $timeFilter GROUP BY time($__interval) fill(none)
Make sure to replace 0000000 with the short UUID of your master node. The value displayed in the balenaCloud dashboard – you may want to highlight and copy it from the screen. Using the “copy” icon will actually copy the much longer “full” UUID.

Below the SQL text box, you should see a drop down for “Format As” that reads “Time series.” Next to that, you should see an “Alias by” text box that reads “Naming pattern.” Replace the “Naming pattern” text with the name you want to identify the master node measurements with, such as “Bedroom”, “Kitchen” or something else descriptive. At this point, you should see some data starting to appear on the chart. Click the “Save” button on the upper right of the page to save the work so far.
We’ll now add our next device to the graph. Above the SQL text box there are a series of icons to the right. Click on the “Duplicate query” icon as highlighted below:

This will create a second query with the same text as our first query. Simply replace the short_uuid value in the second query with the short UUID from the next device you want to graph, and then add a new alias value. You can repeat this step as many times as you want. You can even add other measurements by changing the mean(“temperature”) text to some other valid measurement for your sensor, such as mean(“humidity”).
You should now have multiple measurements (aggregated) on your dashboard. It is highly encouraged to adjust the “display” options under the “Panel” tab on the right to obtain pleasing looking results. Pay particular attention to the “Line width”, “Area fill”, Axes, and Legend options to suit your taste. Don’t forget to click the “Save” button when you’re done!

Integration with Home Assistant
In a previous post we provided a tutorial for setting up Home Assistant on balenaOS. That guide also included steps for integrating balenaSense v1 readings into Home Assistant. While the Home Assistant portion of that guide is still valid, the balenaSense part is not, so here are the updated integration options using balenaSense 2:
Push data to Home Assistant from a device running balenaSense 2 or the simple-sensor application
Add a service variable named MQTT_ADDRESS for the sensor service with the value being the IP address of the Home Assistant device. In other words, if your Home Assistant device’s IP address is 192.168.1.111, then the balenaSense device(s) would have a variable that looks like this:
Make sure MQTT is enabled in your Home Assistant configuration.yaml file, then add a sensor for each measurement you want to make available in Home Assistant. For instance, to add a temperature sensor, you would add the following to configuration.yaml under the sensor: section:
- platform: mqtt

    state_topic: "sensors"

    value_template: "{{ value_json.temperature }}"

    name: "sense_temperature"
You can add multiple entries for any additional measurements your sensor provides, such as pressure or humidity. (You can see all of the Home Assistant options for MQTT sensors here) Don’t forget to restart your Home Assistant server from the Configuration > Server controls menu for the sensor to show up:

If you are sending data from multiple devices, it may be helpful to set a unique state topic on each one so you can differentiate among them when setting up your Home Assistant sensors. Use the MQTT_PUB_TOPIC service variable on the sensor service of each device so all of the measurements sent to Home Assistant do not share the same default “sensors” topic.
Use a sensor attached to your device running Home Assistant on balenaOS
Attach a compatible I2C sensor as described in the “hardware setup” section above and then add the sensor block to your project. You’ll need to clone/download a copy of the project from GitHub and add this to the docker-compose file:
sensor:

    image: balenablocks/sensor

    privileged: true

    labels:

      io.balena.features.kernel-modules: '1'

      io.balena.features.sysfs: '1'

      io.balena.features.supervisor-api: '1'

    environment:

      RAW_VALUES: '0'

      COLLAPSE_FIELDS: '1'
You’ll then need to use the balena CLI to push the updated application to your device. Once the new sensor service is up and running, you’ll need to add the sensor data to the sensor section of Home Assistant’s configuration.yaml file.
Make sure MQTT is enabled in your Home Assistant configuration.yaml file, then add a sensor for each measurement you want to make available in Home Assistant. For instance, to add a temperature sensor, you would add the following to configuration.yaml under the sensor: section:
- platform: mqtt

    state_topic: "sensors"

    value_template: "{{ value_json.temperature }}"

    name: "sense_temperature"
You can add multiple entries for any additional measurements your sensor provides, such as pressure or humidity. Don’t forget to restart your Home Assistant server from the Configuration > Server controls menu for the sensor to show up!
Going further
Until next time
We encourage you to check out all of the customization options available in the blocks that are used to create balenaSense 2: Sensor, connector and dashboard. Between those and all of the settings available in Grafana, who knows what you will come up with? Perhaps you might even want to build your own block… We can’t wait to see what you create!
The Pi Zero is not supported by InfluxDB so balenaSense won’t run on the Zero. However, you can use our “Simple Sensor” project (GitHub – balena-io-playground/simple-sensor: Read sensor data and send via MQTT) on a Pi Zero and send its data to balenaSense or any other project using MQTT.
I have two sensors connected. VEML6070 and BME680.
The VEML6070 sensor is not working for me. Getting an error:
022-03-02T21:43:00Z E! [inputs.http] Error in plugin: [url=http://sensor:7575]: Get “http://sensor:7575”: dial tcp 172.17.0.4:7575: connect: connection refused
The BME680 is working fine.
Hello @cjlfilm I attached the same sensors to a new instance of balenaSense but was not able to reproduce that error. Can you tell me a bit more about your setup, such as the device type and version of balenaOS you’re using?
Do you know if this will work with the Adafruit MCP9600 I2C Thermocouple Amplifier? I have some on order, but thought I would ask before receiving them, because I’m impatient it seems. I need a higher temp range (up to 850*F) with a 5-meter Type-K thermocouple (6 of them, actually), which is why I’m going to try the MCP9600.
Thanks!
I don’t see an iio driver for the MCP9600 available here: Kconfig « temperature « iio « drivers – kernel/git/stable/linux.git – Linux kernel stable tree which is the first step in determining if it works with the sensor block. (If it was there, the next step would be to see if it was included in balenaOS) However, even though it does not work with this block, you could easily install the Adafruit module in a container with pip3, following the instructions here: GitHub – adafruit/Adafruit_CircuitPython_MCP9600: CircuitPython driver for the MCP9600 thermocouple I2C amplifier. and using the simple Python example on the same page.
I’ll go take a look at the code there – thanks for the info!
I used balenaOS 2.82.10+rev1 with VELM6070 and BME680 in parallel. Should be fine. In the mean time, the BME680 has failed. The sensor is not at all suited for outdoor use, due to condensation. Sensor was installed inside a stevenson screen. Is there any sensor available, suited for outdoor (north-west europe) use? Or maybe a way to protect the sensor from condensation inside the sensor cavity, without interfering with results?
Hello @cjlfilm you could try a thermocouple which is pretty rugged against moisture, but it will only provide temperature readings. Adafruit mentions that the SCD-40 is suited for outdoor use but it costs a bit more for the CO2 functionality, although you also get temperature and humidity readings. I’ve been using an SCD-30 outdoors in a small stevenson screen for about four months in the Northeast US harsh winter/ wet spring with no problems, although it’s protected a bit under a roof overhang. I can’t guarantee you’ll get the same results though! Note that none of these are currently supported by the sensor block, so you’d have to install their respective drivers in a container.
If you could provide instructions on how to install the drivers, that would be great. Will CO2 show up in balena sense?
You can take a look at our Air Quality device project for an example of how to install the drivers for a sensor in a container: balena-iaq/iaq at master · balena-io-playground/balena-iaq · GitHub
BalenaSense itself will not show CO2 because none of the supported sensors have CO2. However, since balenaSense is built with blocks, you can copy most of the services it uses and just replace the sensor block in a manner similar to the project mentioned above. For more details about the “building blocks” of balenaSense see this post: balenaBlocks in-depth: Sensor and Pulse
Hopefully this will be enough information to get you started but please reach back out if you get stuck!